Many Pennsylvania Historic Preservation blog readers are familiar with the results of Year 1 and Year 2 of the Pennsylvania Baseline Survey but did you know that the Pennsylvania Baseline Survey is doing archaeology too? We have adapted to recording not just historic buildings, but also documenting the locations where important buildings once stood.
If you are not yet familiar, the Pennsylvania Baseline Survey is a widespread cultural resource survey effort that began in 2020. The goal is to collect a minimum amount of locational and physical data and photographs about historic properties – also known as the minimum record. The effort is focused on adding new places to the PA Historic Places Inventory rather than updating existing information.
Fifty-two counties were identified to be surveyed over a 3-year period. Currently, the Pennsylvania Baseline Survey is on the third and final year of surveys. To date, 13,509 historic places have been surveyed.
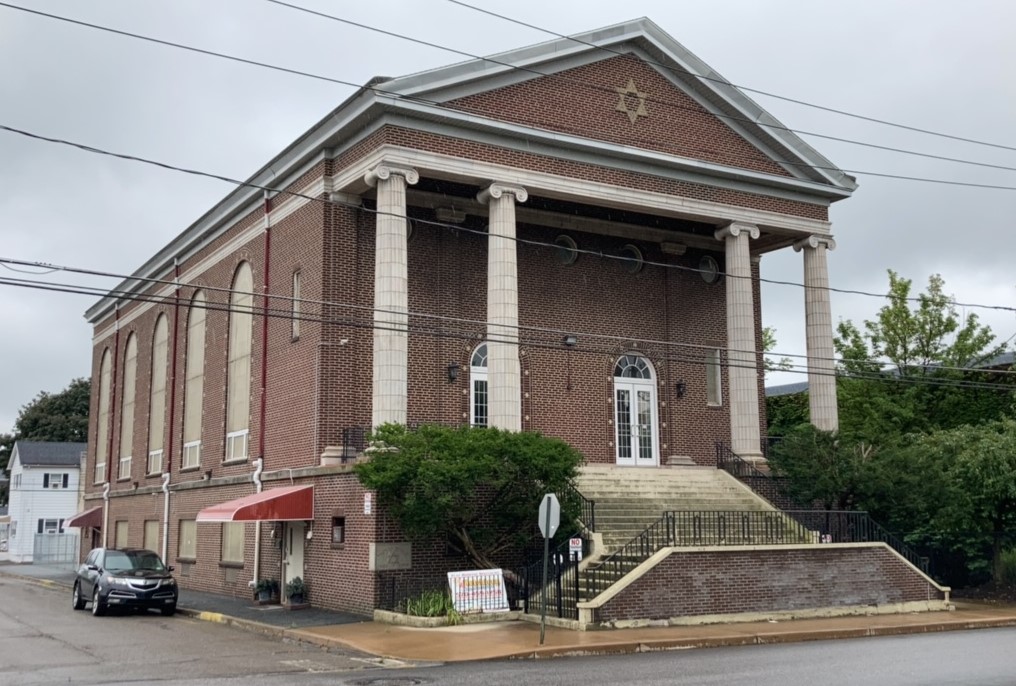
The Agudas Israel Congregation in Hazleton, Luzerne County was one of the 6,663 places recorded in Year 2 of Pennsylvania’s Baseline Survey.
During Year 1, survey teams were finding that properties they had located in historic publications and maps were no longer standing in their present-day location. The property had been demolished, sometimes leaving behind remnants of a foundation or other building materials that indicated that a building was there, but not enough to survey using the buildings survey form.
For Year 2, we developed the concept of surficial archaeological evidence to help account for the remnants of these important properties that are no longer standing.
Surficial Archaeological Evidence
Surficial Archaeological Evidence is the indication of one or more former structures or activity areas that are visible on the surface, such as foundations, middens, other features or altered terrain, that are 50 years old or older. While the focus of this project is on visible evidence, the lack of such evidence does not mean that a potential archaeology site does not exist, particularly if suggested by background research.
Under the supervision of qualified archaeologists, survey teams were asked to document examples of surficial archaeological evidence using PA-SHARE’s Surveyor archaeological resource form. Baseline survey methodology did not include any excavation and required that survey teams stay within the public right of way during field survey. Therefore, it is important to note that not all areas documented using an archaeological resource form received an official PASS number.
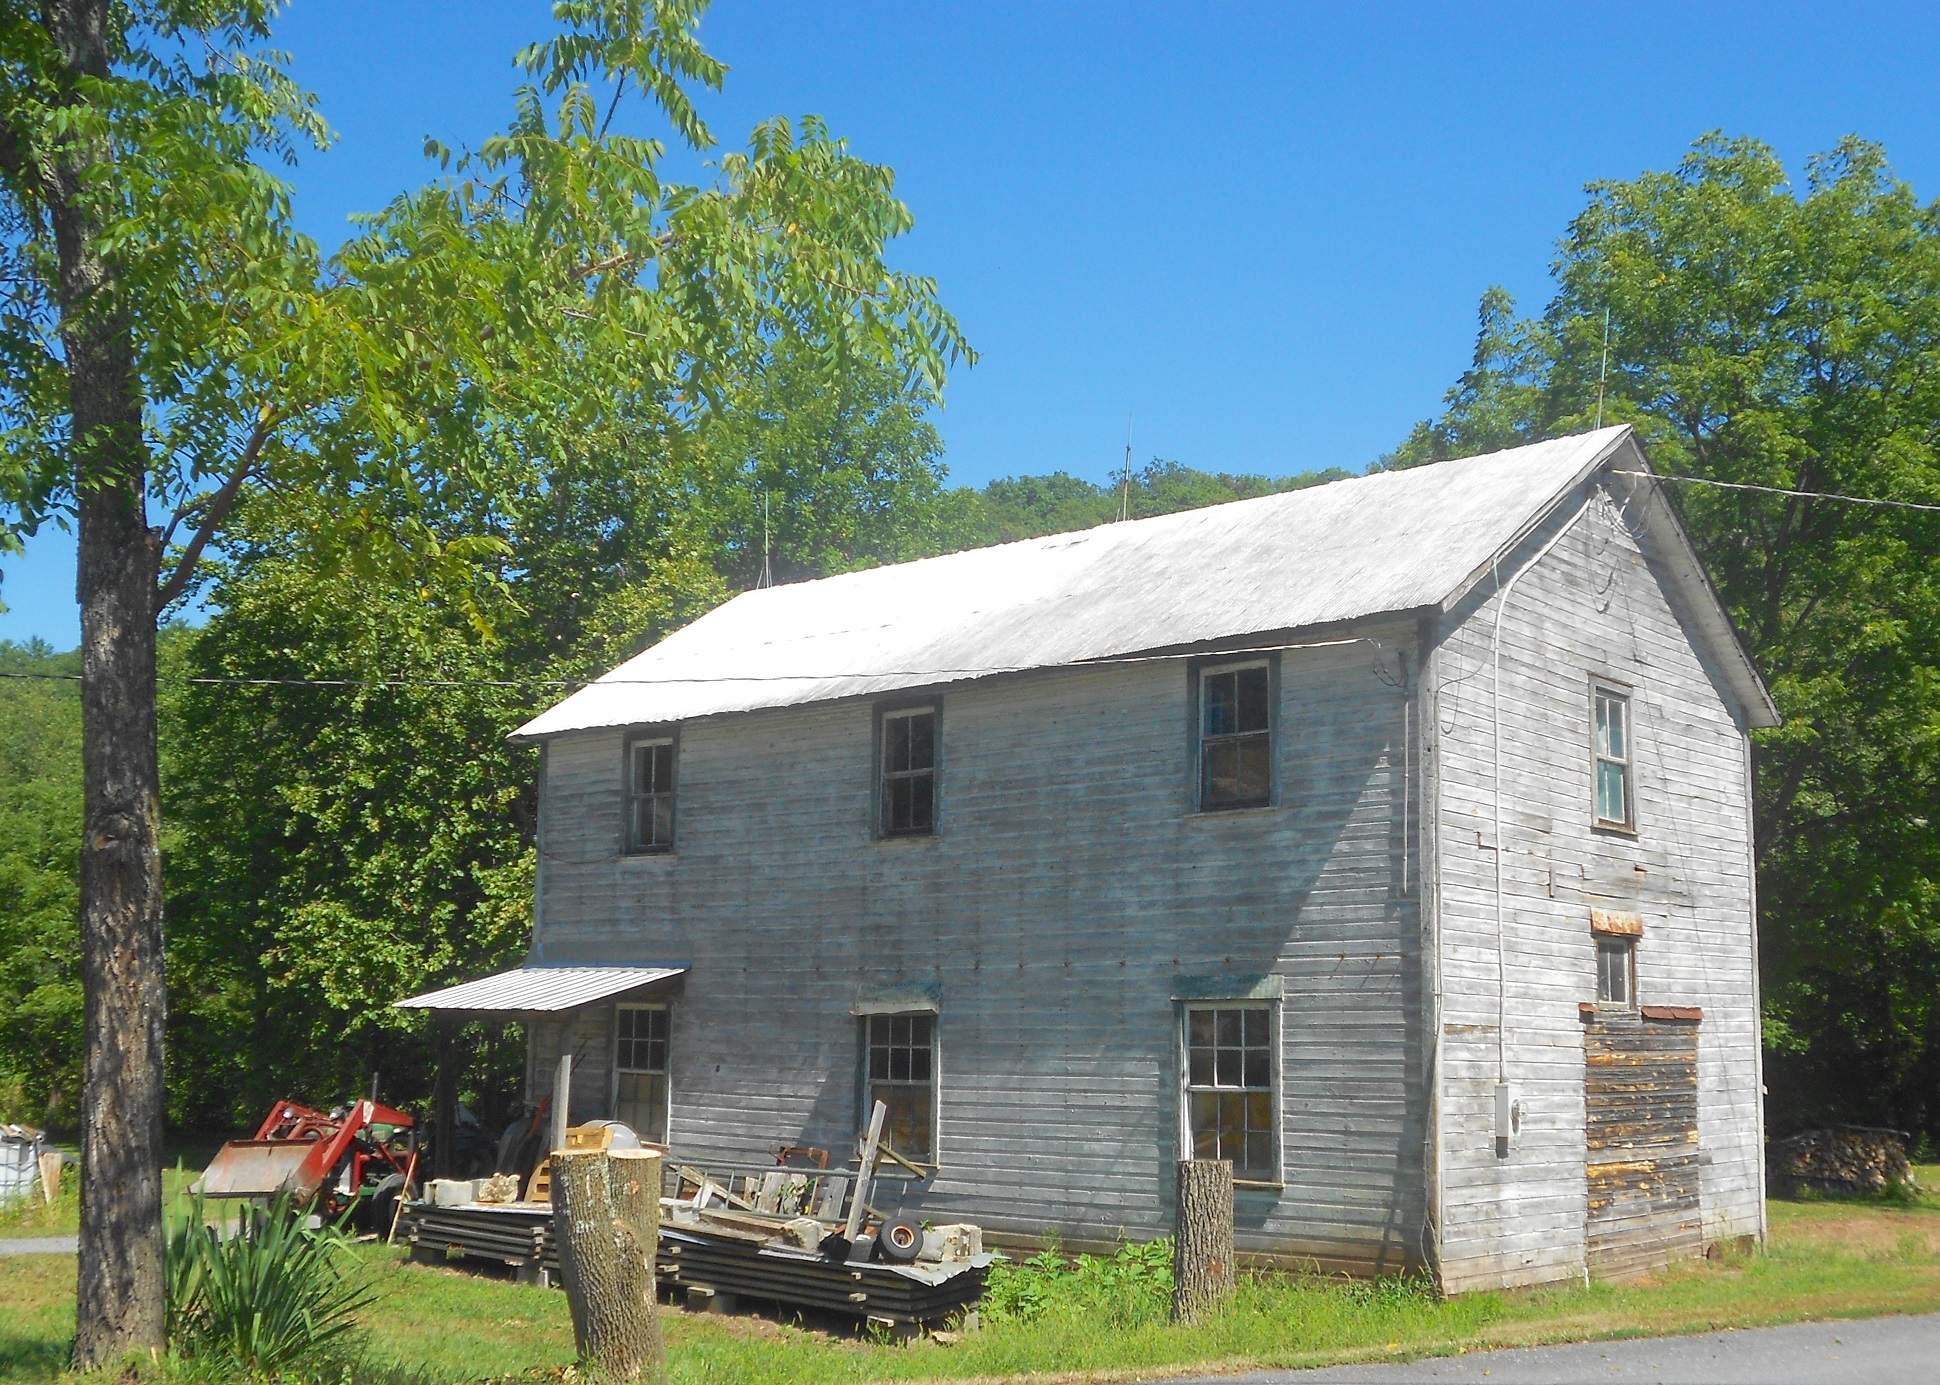
Through Baseline Survey, this former tannery in Fulton County was recommended as an area for further archaeological investigation based on archaeology potential noted during research.
A majority of areas documented require additional investigations to assess if an archaeological site is present. Archaeological sites represent non-renewable resources. That means that if sites are excavated or disturbed without proper documentation, the information and context of the site is lost. Furthermore, sites often contain culturally sensitive information.
Because of this, archaeological site data is restricted in PA-SHARE and site location and certain attribute information can only be viewed by individuals with advanced degrees in archaeology. However, despite the restricted nature of archaeology data, we can still discuss the resources our survey teams used to locate potential archaeology sites and surficial archaeological evidence.
You can also read about archaeology in Baseline Survey in this year’s PASS report.
Surficial archaeology can be anywhere, and our survey teams have utilized data from old fire insurance maps and historic aerial photography to locate surficial archaeology sites. In this blog, we are going to show how these resources are used and how we document these places using our unique approach.
Sanborn Fire Insurance Maps
Fire insurance maps were widely used in the United States starting in the mid-19th century through the mid-20th century. They show the location and building material of structures in an area. These maps also noted the location of fire hydrants and utilities and would label the name of important buildings, such as schools, factories, hotels, religious buildings, and businesses. They were essential for determining the fire risk and liability in urbanized areas of the United States. While many companies produced these maps, the Sanborn Map Company was the most prolific, producing maps in thousands of cities and towns across America.
Today, Sanborn maps are used by historic preservation professionals to understand the significance and historical evolution of buildings. They are an excellent resource to understanding the urban development of an area, as many cities would have multiple maps made over time to account for new construction and newly densified areas. Pennsylvania State University maintains a free digital depository of Sanborn Fire Insurance Maps for the State of Pennsylvania. This overview by the Library of Congress is helpful in understanding more about the maps and how to use them.
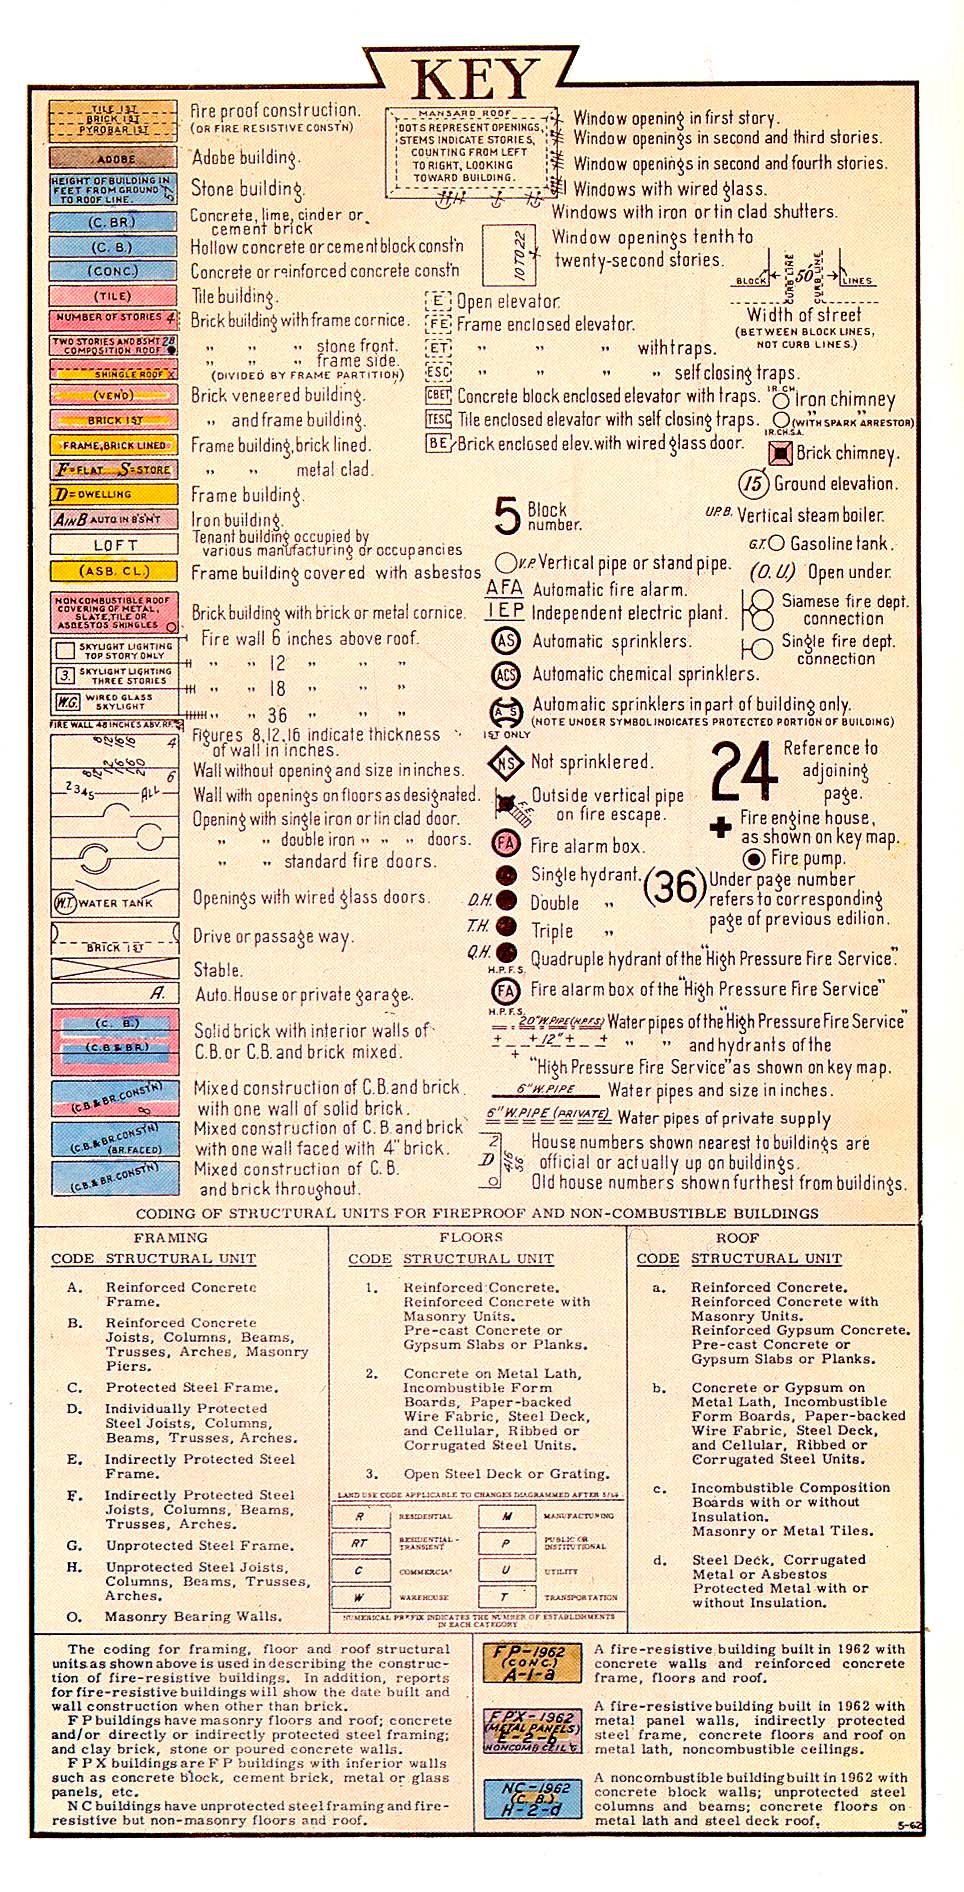
Figure 1: Sanborn map key.
Figure 1 shows a key for all Sanborn maps. Buildings are color-coded based on their materials and symbols are used to show door and window openings, locations of sprinkler systems, pipes, and other utilities. Understanding the key is useful for preservationists because it tells us what the original building materials were for a building. For commercial, religious, and industrial properties, the map may also be labeled with the use or name of the building.
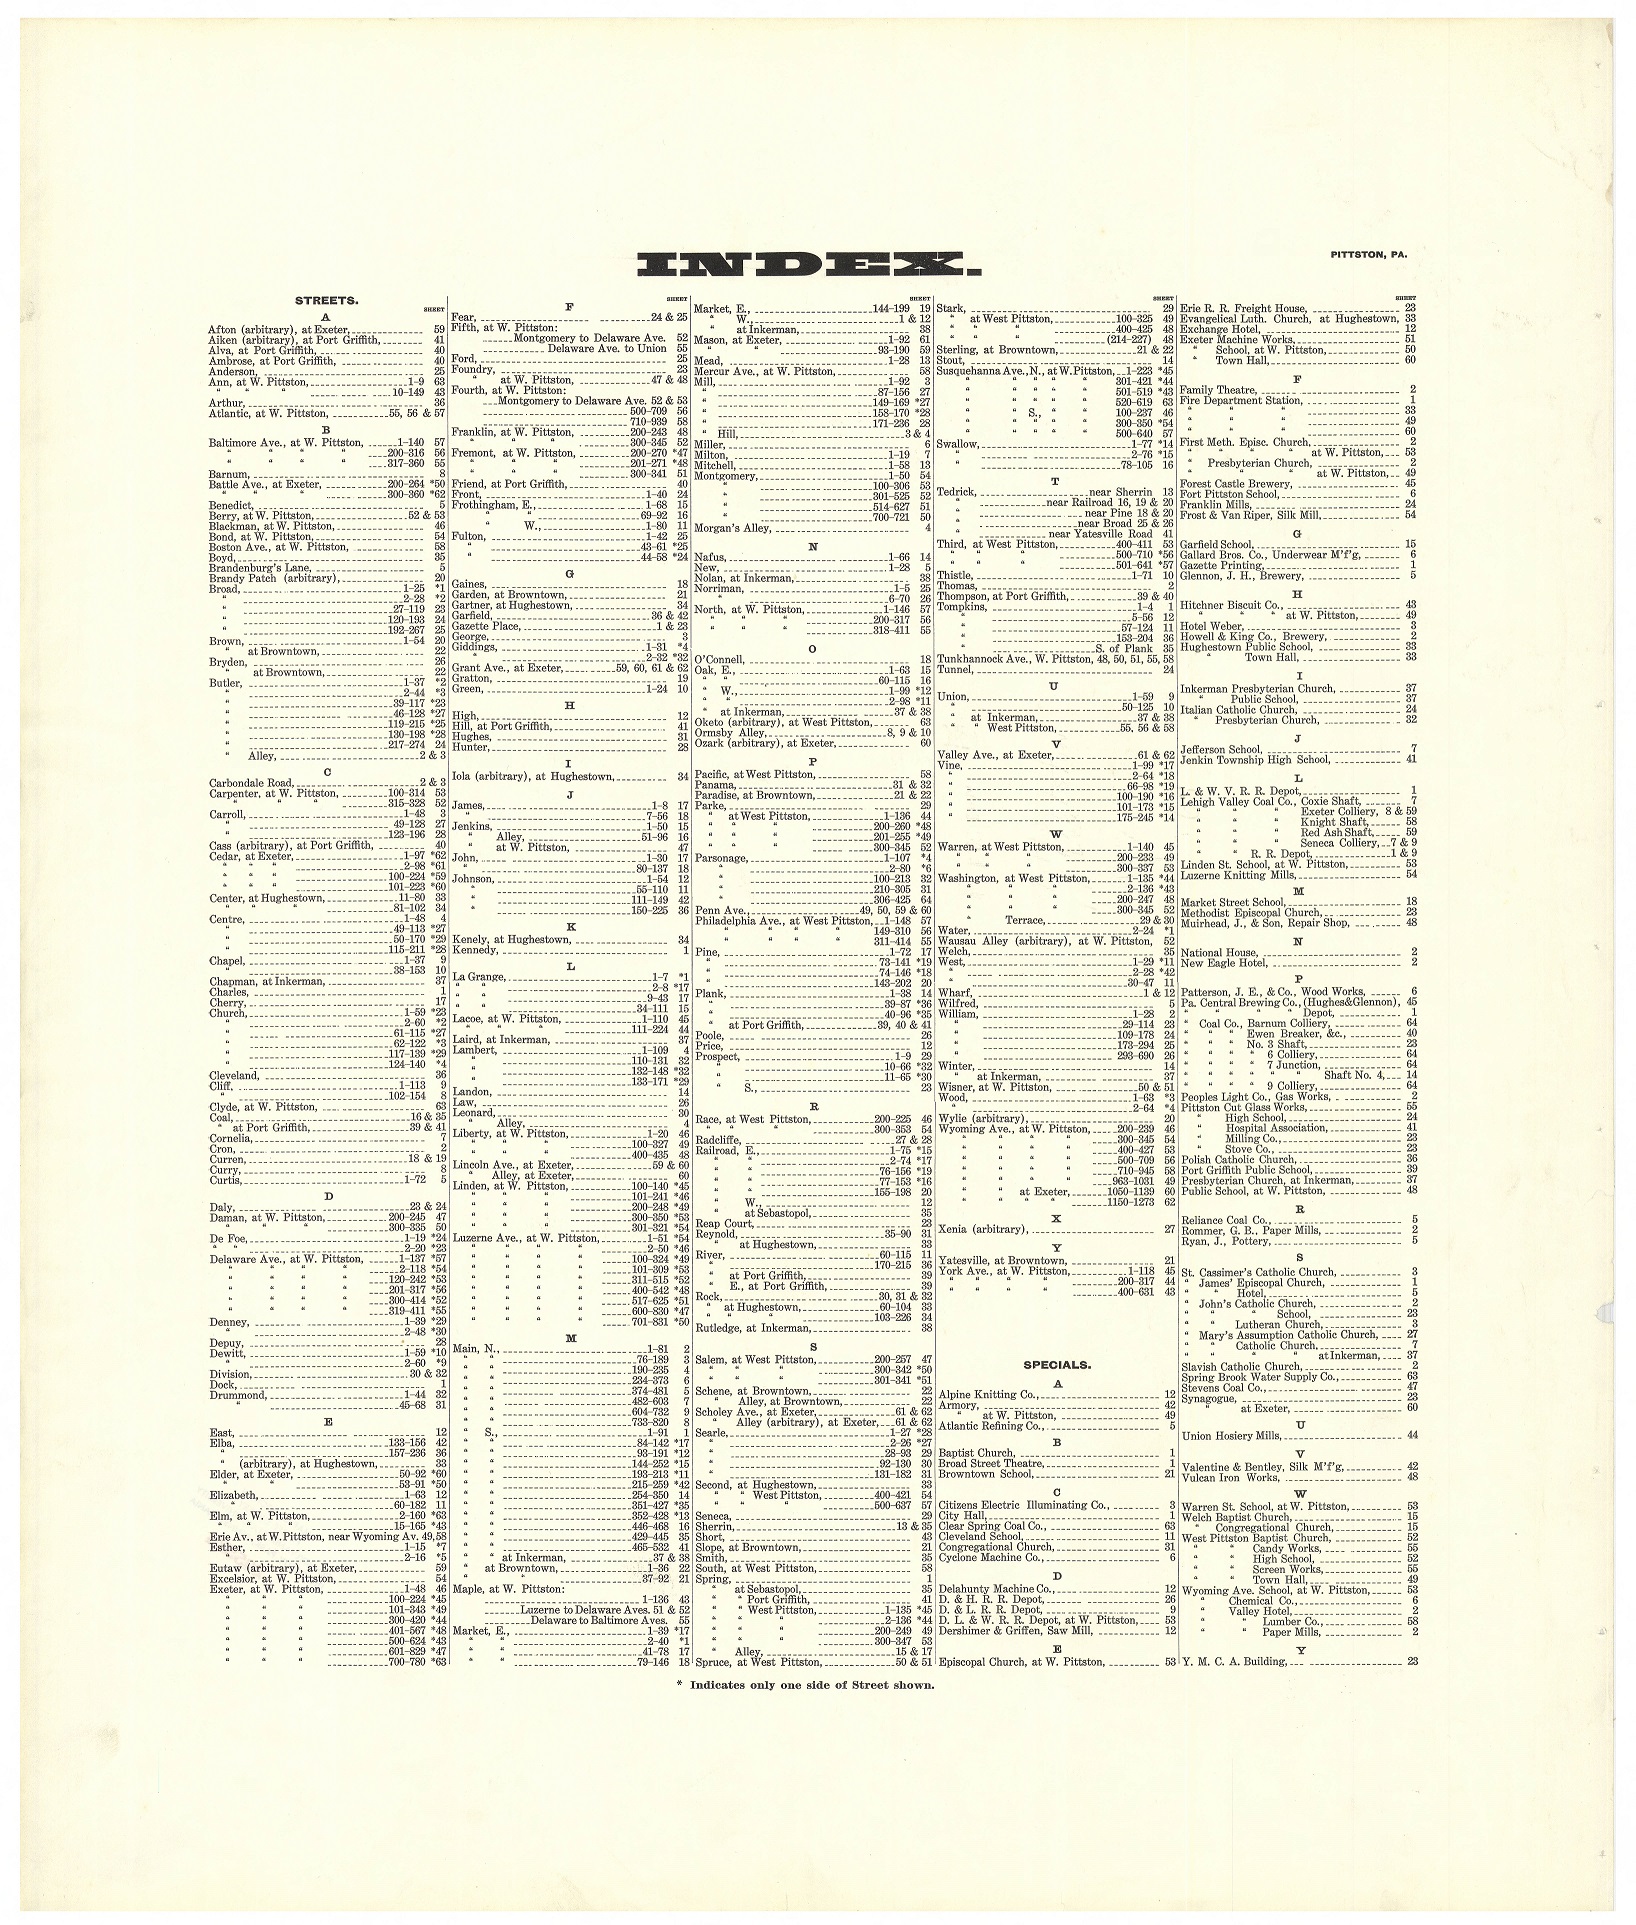
Figure 2: Sanborn map index page.
The Sanborn map index, like the one in Figure 2, is used to locate specific streets in whatever municipality’s map is being viewed. Streets are organized alphabetically. The “Special” section was especially helpful for the Pennsylvania Baseline surveyors. Properties in the Special category are specific place names such as churches, synagogues, social halls, factories, mills, government buildings, railroad depots, and hotels, among others.
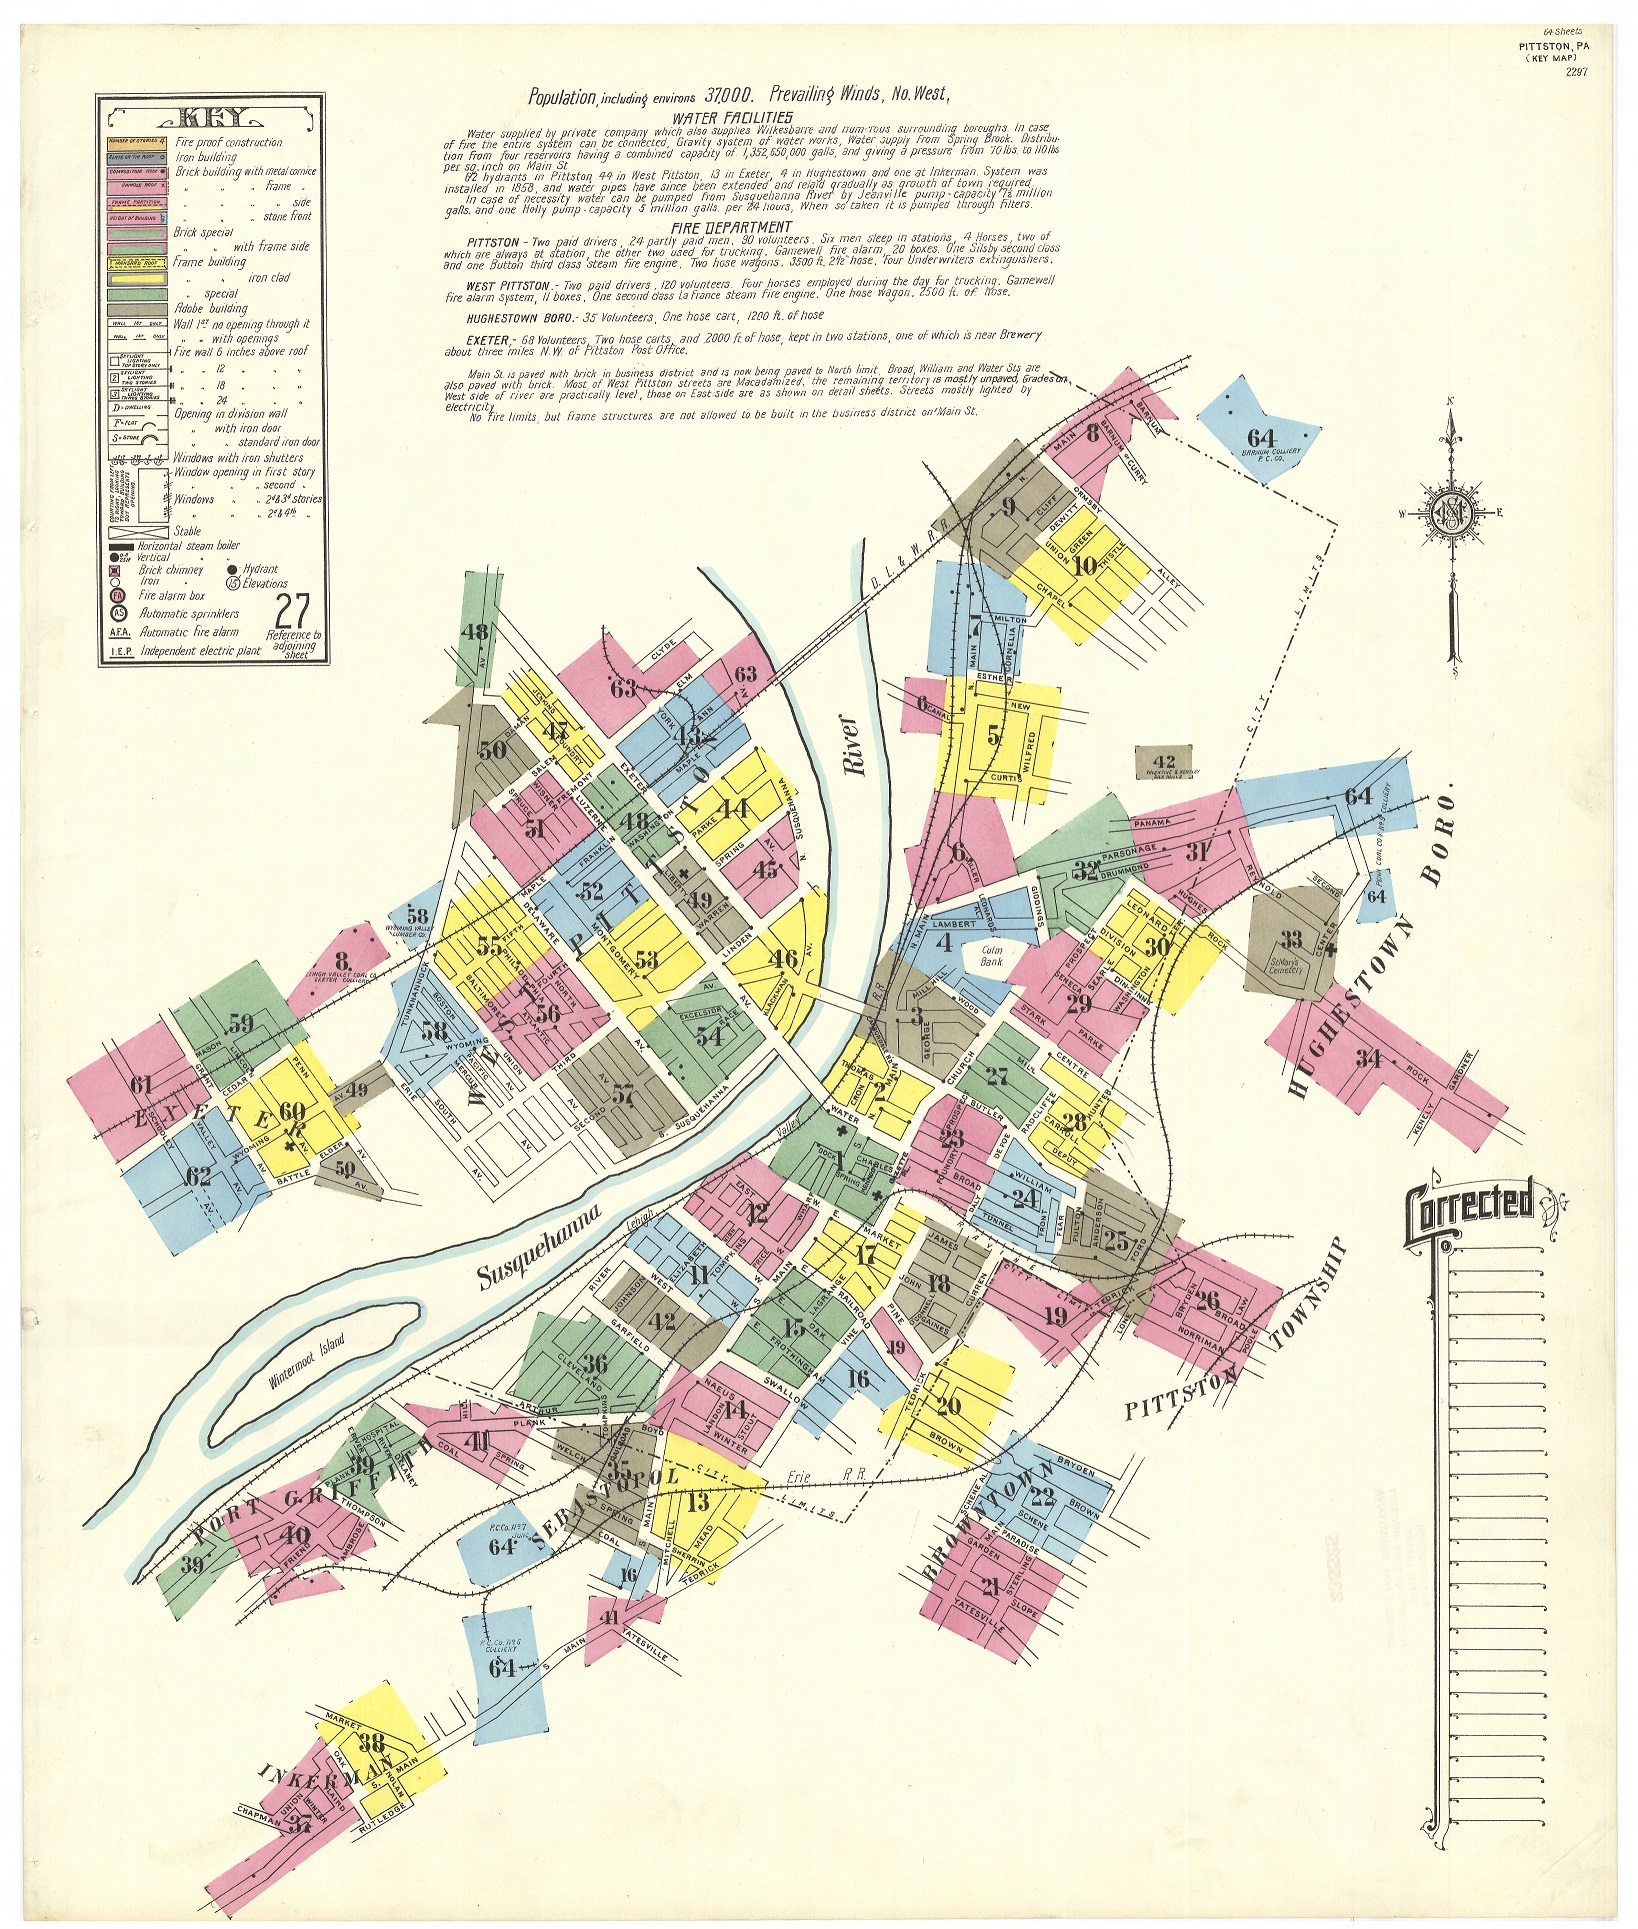
Figure 3: Sanborn Map Key of Pittston, PA.
You can also locate areas of interest using the map key, like the one in Figure 3, often found on the first few pages of a Sanborn map book. The color-coded, numbered sections refer to pages for each section of the municipality that has been mapped.
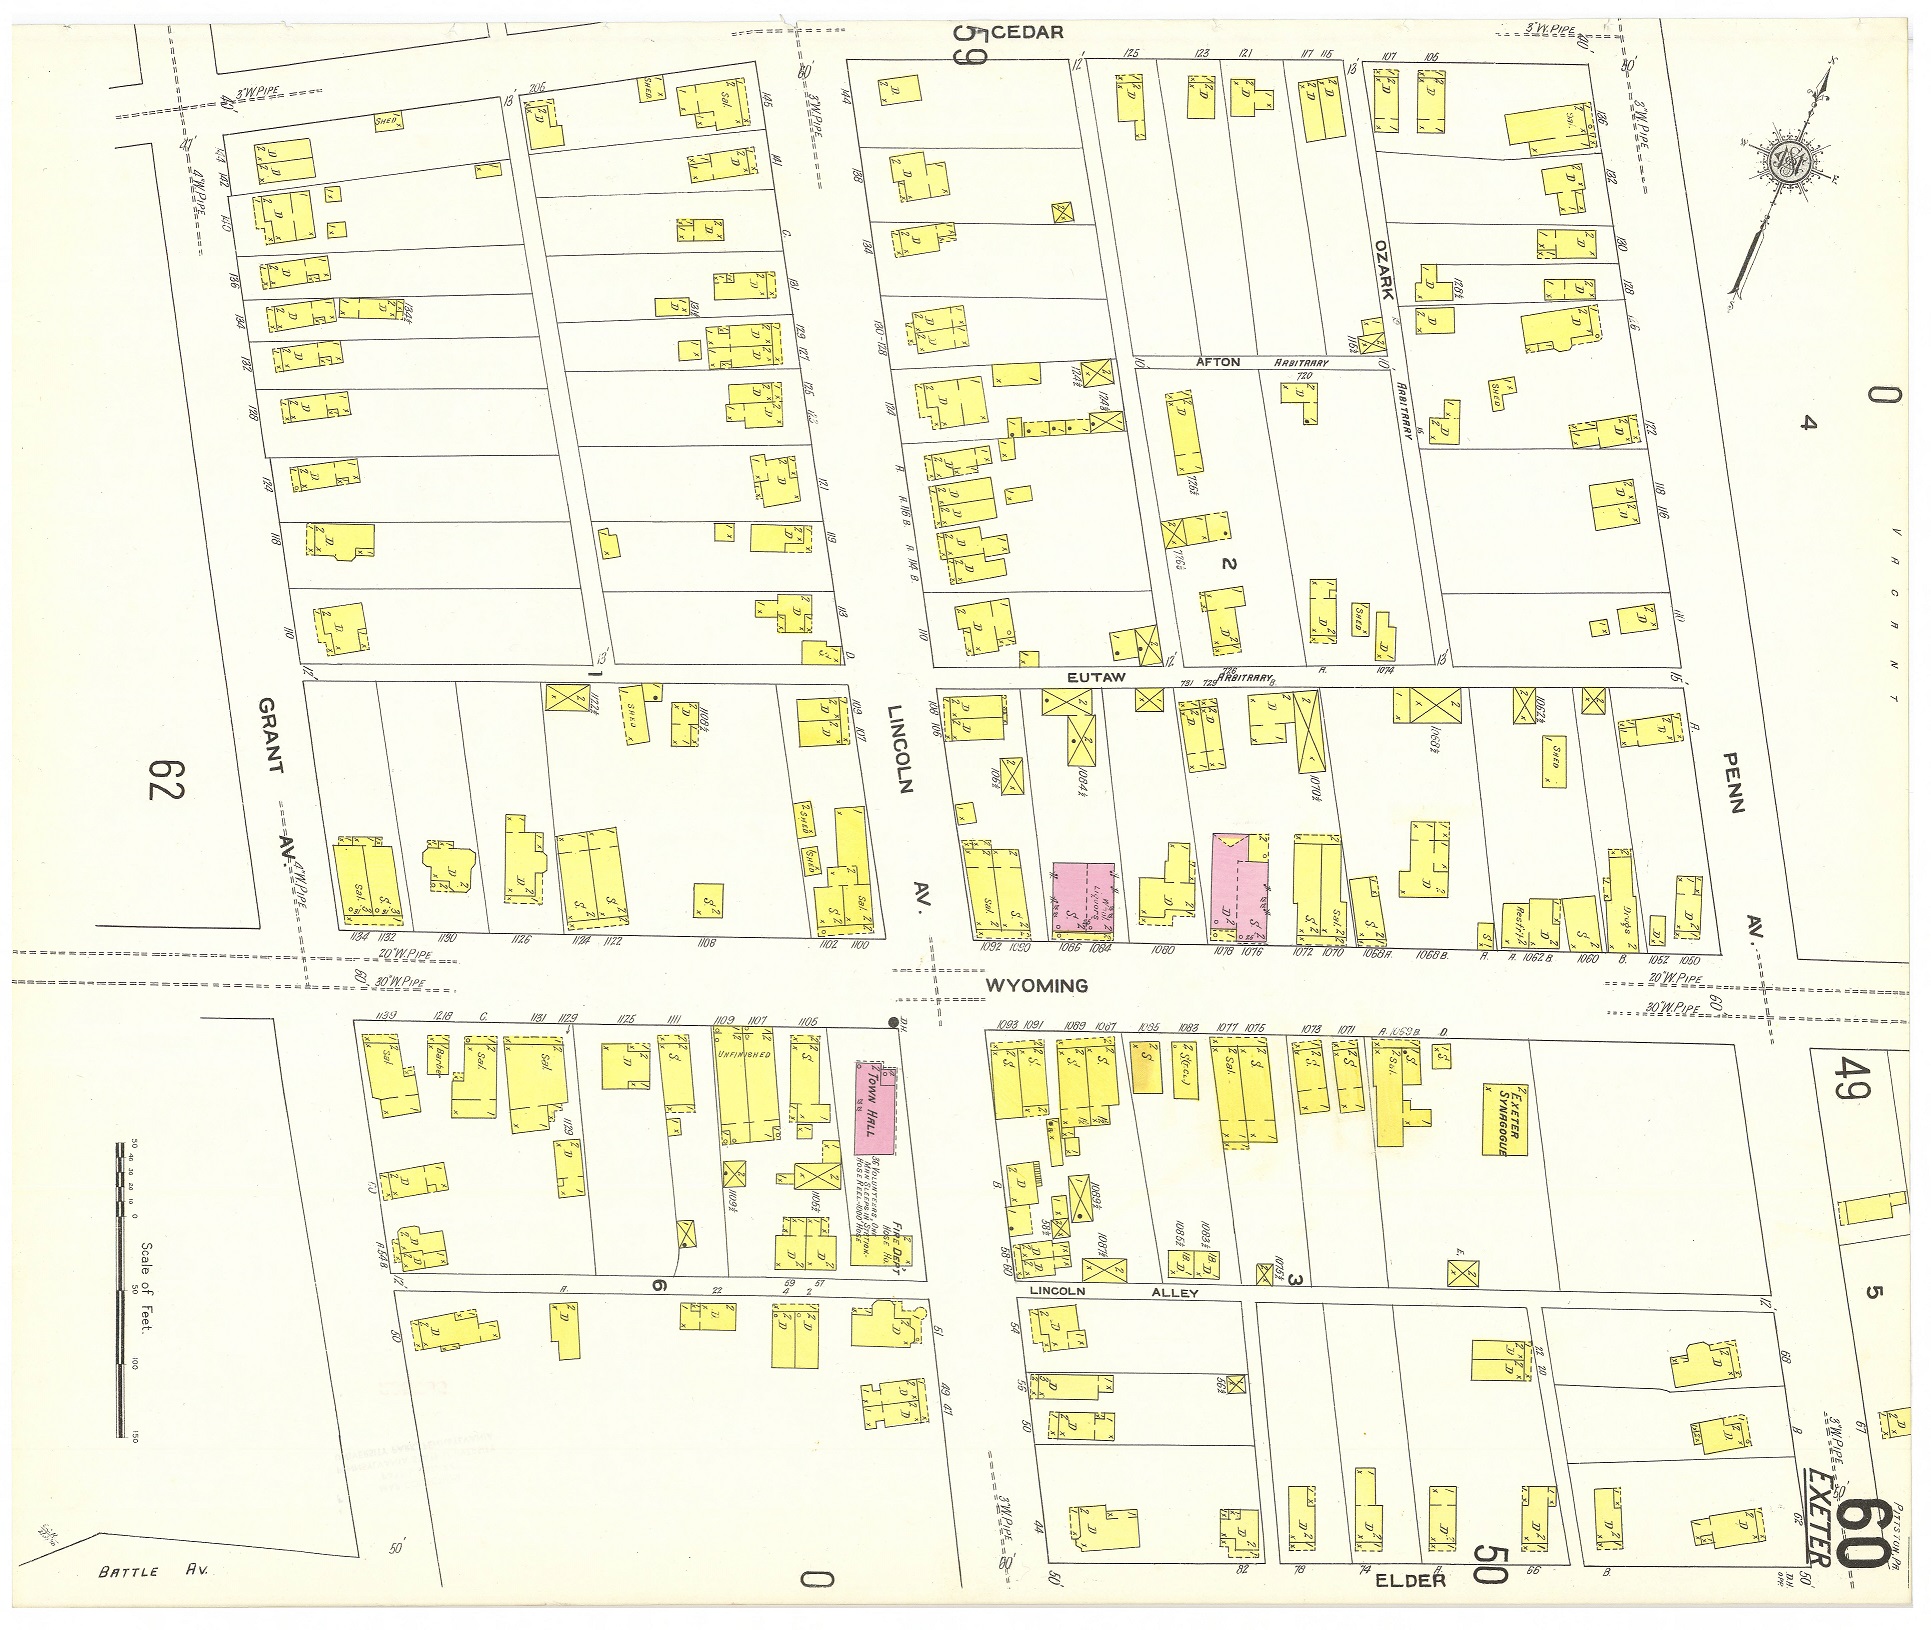
Figure 4: Detail page of a Sanborn map.
Figure 4 is page 60 of the 1910 Sanborn insurance map of Pittston. Here we can see that most buildings in the area are made of wood frame, as noted by the yellow shading, and are predominantly 2-story dwellings, as noted by the letter “D” and the “2” printed on most buildings. There are three brick buildings in this part of town that are colored pink, including the old Exeter Town Hall.
Other buildings of note include the numerous stores, labeled with an “S” along the Wyoming Avenue corridor and the Exeter Synagogue, located to the southwest of the intersection of Penn Avenue and Wyoming Avenue. During the Baseline Survey, the Exeter Synagogue, also known as Anshe Ahavas Achim Synagogue, was demolished sometime between 1981 and 1982, according to observations made using aerial photography.
Rise of Aerial Photography
Sanborn maps and fire insurance maps in general became less popular to produce from the late 1930s through the late 1950’s. The growth of the insurance industry and the advent of better building codes that improved fire prevention methods meant that fire insurance maps became less important. However, preservationists and archaeologists still have access to historic aerial photography to help identify the construction and demolition dates of buildings.
The first aerial photo is credited to Gaspard Felix Tournachon, who took a photograph of the Petit-Clamart suburb of Paris from a hot air balloon in 1858. Aerial photograph technology became much more sophisticated with the invention of planes and as a result of World War I. Many veterans went on to establish aerial photography companies after the war ended. These technologies were used in the public sphere to revolutionize the cartography field.
Today, aerial photography continues to advance and good quality aerial images are readily available on public-access websites, such as Google Maps. A repository of historic aerial imagery is maintained by NETROnline called Historic Aerials. The images are free to view with a watermark, but a subscription is needed to print maps.
Historic Aerials by NETROnline allows users to look up addresses and street names, as many of us are familiar with doing on online and phone-based mapping services like Google Maps or Bing. Consider the Exeter Synagogue – we can search Wyoming Avenue in Exeter and view the area that aligns with what was observed on the Sanborn Map.
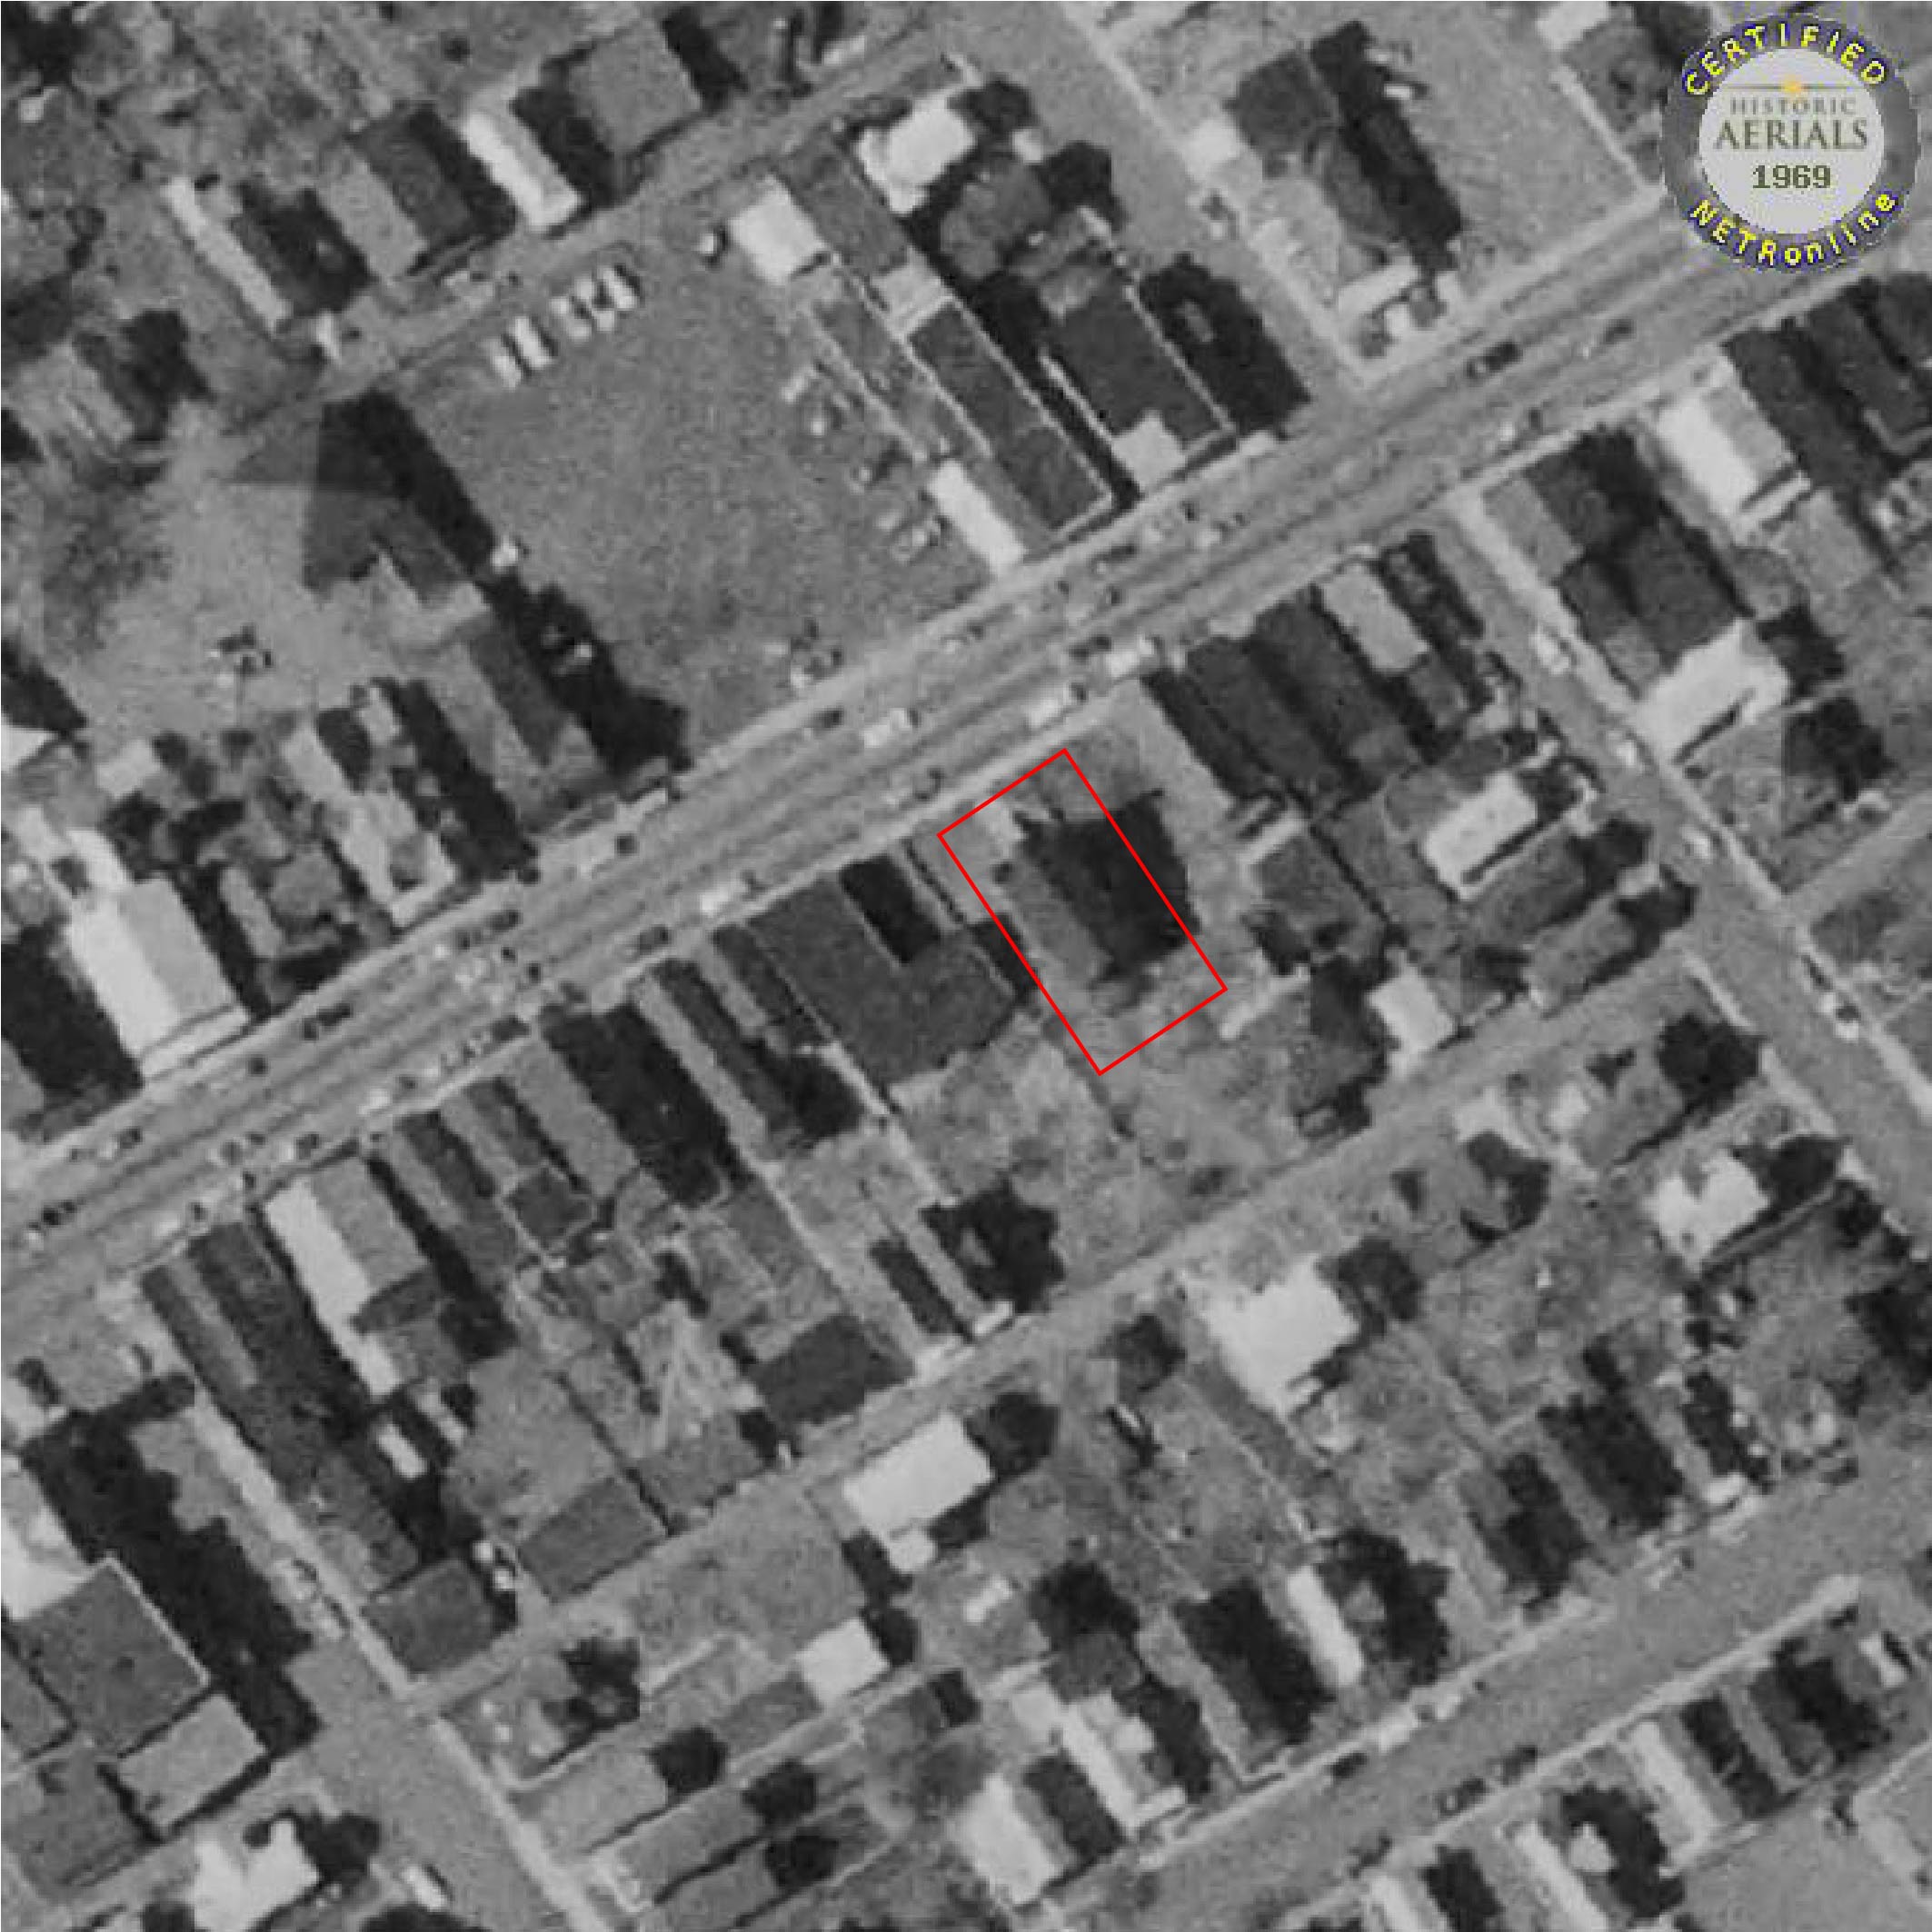
Figure 5: 1969 Aerial Image of Exeter Synagogue.
Figure 5 shows a 1969 black and white photo of Wyoming Street with the Exeter Synagogue still standing, encircled in red. Notice how the orientation of the street in the aerial photo is different from the Sanborn map. This is because the photos are oriented to face North, while the Sanborn map is not.
Color photography became more reliable in the 21st century. While color aerial photographs exist for earlier, the image quality may be worse than their black and white counterparts.
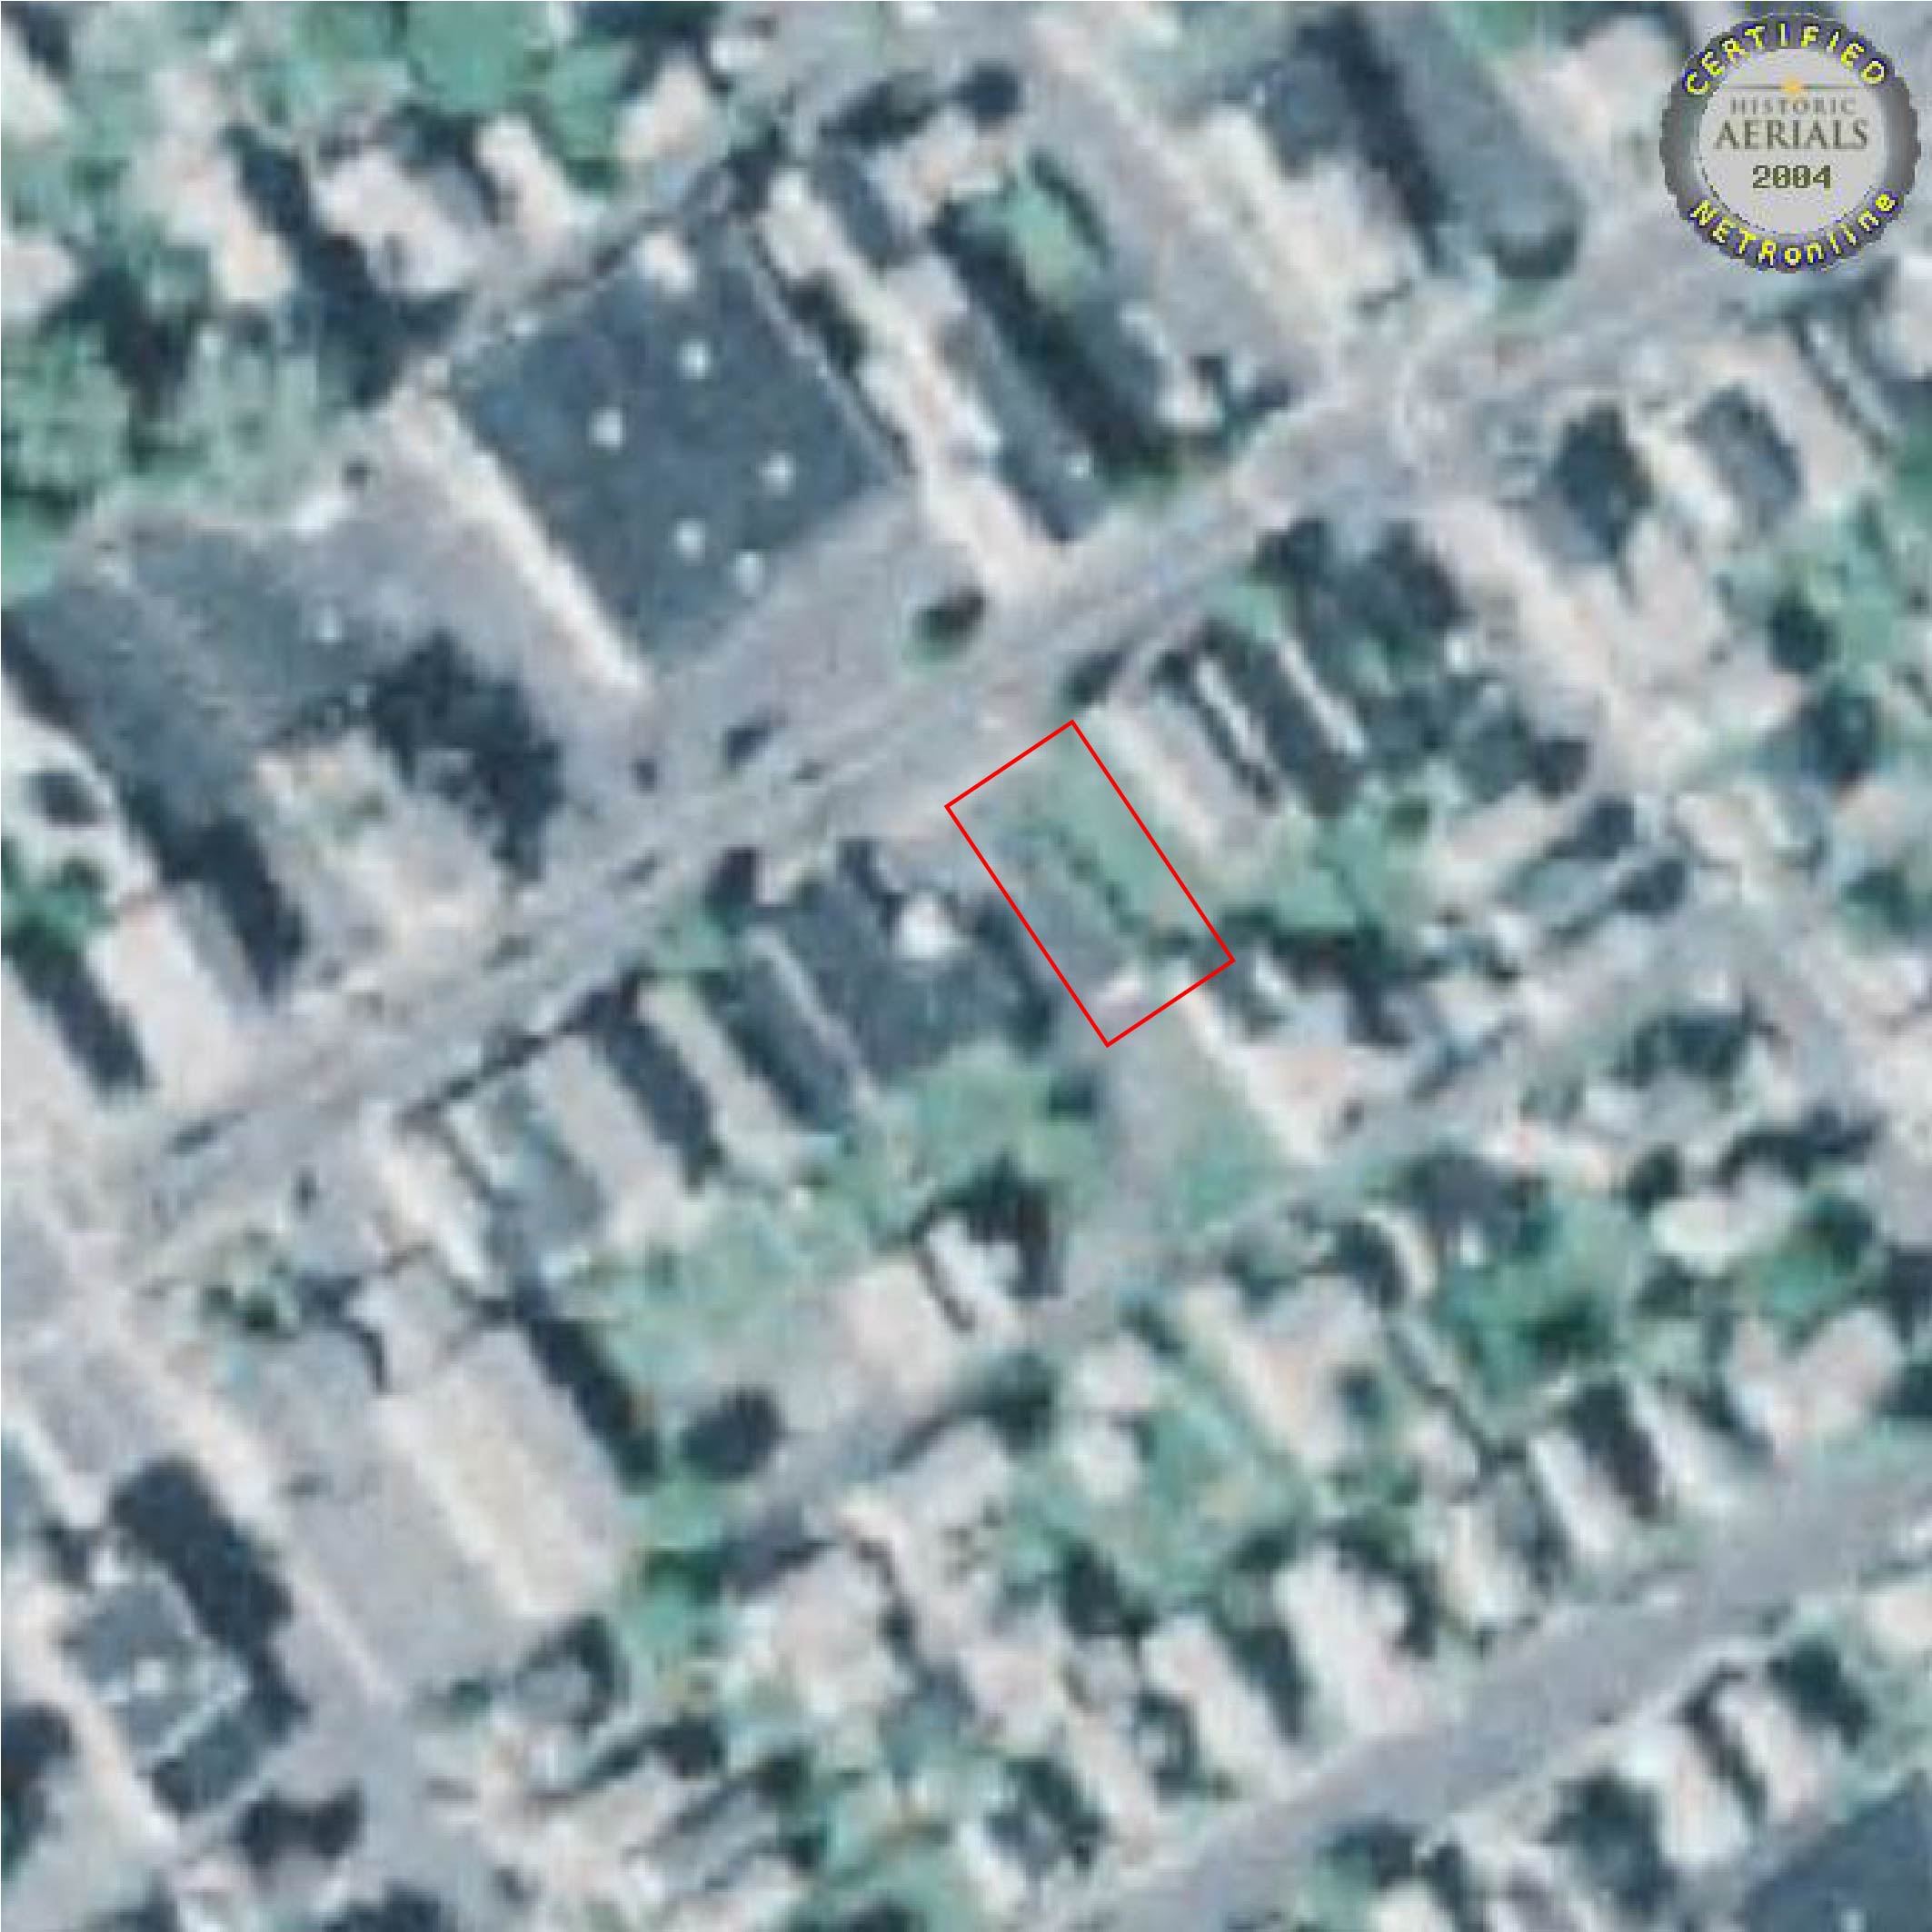
Figure 6: 2004 Aerial image of Exeter Synagogue.
Figure 6 shows a color aerial image of the same area from 2004 – notice anything missing? The Exeter Synagogue is gone, the lot appearing to have a portion of a parking lot and some landscaping on it.
Notice other changes in the neighborhood from 1969 to 2004, such as the construction of a large building where there once was a parking lot. Notice what remained the same, such as the wood frame houses on the street behind Exeter Synagogue.
Even though a resource may be gone, we can still use the evidence of its existence available to us to document and acknowledge its place within a community’s history. This is the ultimate goal of creating the concept of Surficial Archaeological Evidence within the Pennsylvania Baseline Survey.
In Year 2 of the Pennsylvania Baseline Survey, we identified and documented 306 potential archaeological sites using the archaeology survey form! The Pennsylvania Baseline Survey will be active in 17 counties in 2023 and hope to continue to add to the above and below-ground record of Pennsylvania.
_________________________________
Today’s Guest Author is Carolyn Gimbal, an architectural historian with Johnson, Mimiran & Thompson, Inc.
Leave a Reply