Did you know that the Lehigh Valley was once a major producer of potatoes? Or that Tioga County had a robust tobacco-growing industry? Or that Southwestern Pennsylvania was known for its sheep farms? The list of agricultural products grown and produced in Pennsylvania over the past 300 years is as long and diverse as the state is large. When you put all of these pieces of information on a map, some very interesting and unexpected patterns emerge, and these patterns have a lot to tell us about why our agricultural buildings and landscapes look the way that they do.
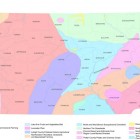
As one way of sharing this interesting information about agricultural production patterns in Pennsylvania with the general public, the Bureau for Historic Preservation’s (BHP) exhibit at the 2013 Farm Show will showcase the map prepared as part of the recently completed Pennsylvania Agricultural History Project. The map, which illustrates the 16 distinct agricultural regions, is the exhibit’s centerpiece.
While the regional boundaries are not hard and fast, in general these regions share soil types, topography, and climate. They also possess in common historical production patterns, social makeup, land tenure customs, labor forces, and cultural makeup.The supporting narratives found in the agricultural context explain in detail each region’s characteristics.
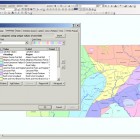
While the geographic regions displayed on the map were determined by the researchers from Penn State, the task of digitizing the map was undertaken by the PHPO’s CRGIS Section. They provided us with a pdf of the completed region map and we used ESRI’S ArcGIS 10.1. to geoprocess the image, or position the image in a GIS so that it was aligned with the Pennsylvania border.
The next step was to begin tracing the outline of the regions. Doing this created what is called a shapefile. Inside of the shapefile, each region is represented by an individual polygon with attribute data behind it. In the table of attributes you can input any data that you feel is needed. For our purposes we limited the attribute data to contain an automatically generated identification number and the name of the agricultural region. Once this was complete, a color scheme was chosen and applied to the selected attribute of the shapefile. This process is called Color Classification.
After the colors were chosen and finalized we added a layer that has the outlines of the 67 counties of Pennsylvania. We set the label of this layer so that it will display all of the names of the counties. In the eastern portion of the state, some of the county names are too long to fit inside the borders of their polygons. These names then have to be moved or turned so that they fit in a reasonable and eye pleasing manner.
When all of these layers were compiled, the map was complete and we exported it from ArcMap into an image that can easily be used by our staff and others outside the agency. We chose a TIFF format for sending to our exhibit staff and a JPG for use on our website.
In addition to maintaining the maps and data bases of historic and archeological records of the Commonwealth, the CRGIS Section prepares graphics and reports for other BHP Divisions and outside users.
The Pennsylvania Agricultural History Project was a collaboration among the Pennsylvania Historical and Museum Commission’s Bureau for Historic Preservation, the Pennsylvania Department of Transportation, U.S. Department of Transportation, the Federal Highways Administration, and the Pennsylvania State University. For more information please visit our website. http://phmc.info/aghistory)
To see the final image used for our display, please come to the Pennsylvania Farm Show and visit our booth. We look forward to seeing you there. The Farm Show is open daily, Saturday, January 4 – January 11 and is generally open from 8:00 a.m. – 9:00 p.m.


Leave a Reply