As we mentioned in our recent post about new archaeology guidelines, The Federal Highway Administration (FHWA), the Pennsylvania Department of Transportation (PennDOT), and PHMC partnered with URS Corporation to develop a statewide pre-contact archaeological predictive model for Pennsylvania.
The project involved developing statistical models to analyze the landscape at known Native American archaeological sites in Pennsylvania and extrapolating identified patterns to all areas of the commonwealth. Due to the variability of environments and pre-contact cultures throughout Pennsylvania, many different models were produced for different areas.
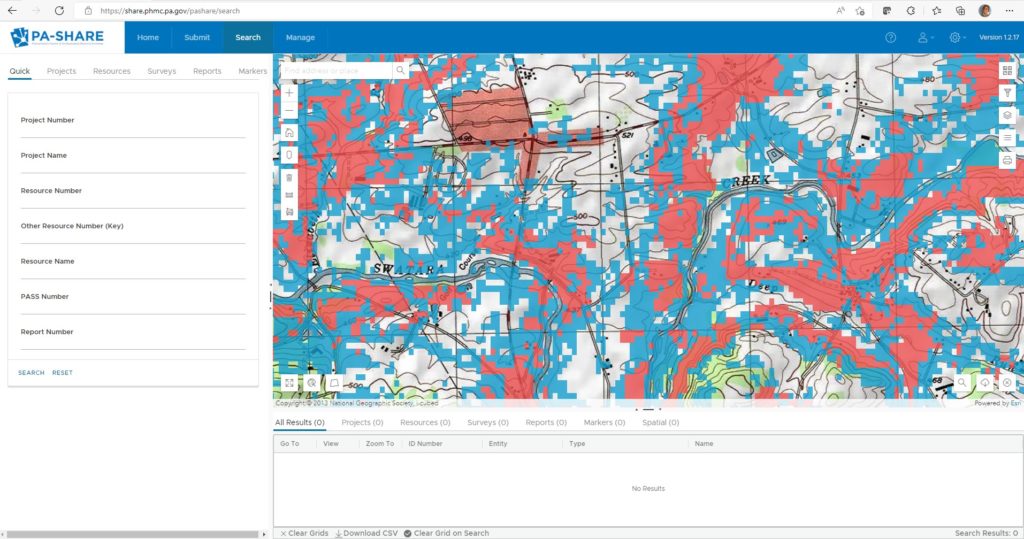
One of the major accomplishments of the project is a complete statewide layer of archaeological sensitivity aggregated from 132 spatial subareas. This has been included in PA-SHARE as layer that indicates high and moderate probability. PA-SHARE’s Pro and Business users can include in the layer in their spatial search exports.
A summary report is available through PennDOT’s ProjectPATH. The authors, Matthew D. Harris, Robert G. Kingsley, and Andrew R. Sewell from URS (now AECOM), have provided a very thorough description of the modeling process in that document, and I highly recommend it to those who want to understand how it was created. For those who want the 10,000 foot view of the process, here are some of the basics:
Caveats:
- Only Pre-Contact sites considered
- Based on existing site files
- Different models in different places (depending upon data available)
- Not field verified (YET!)
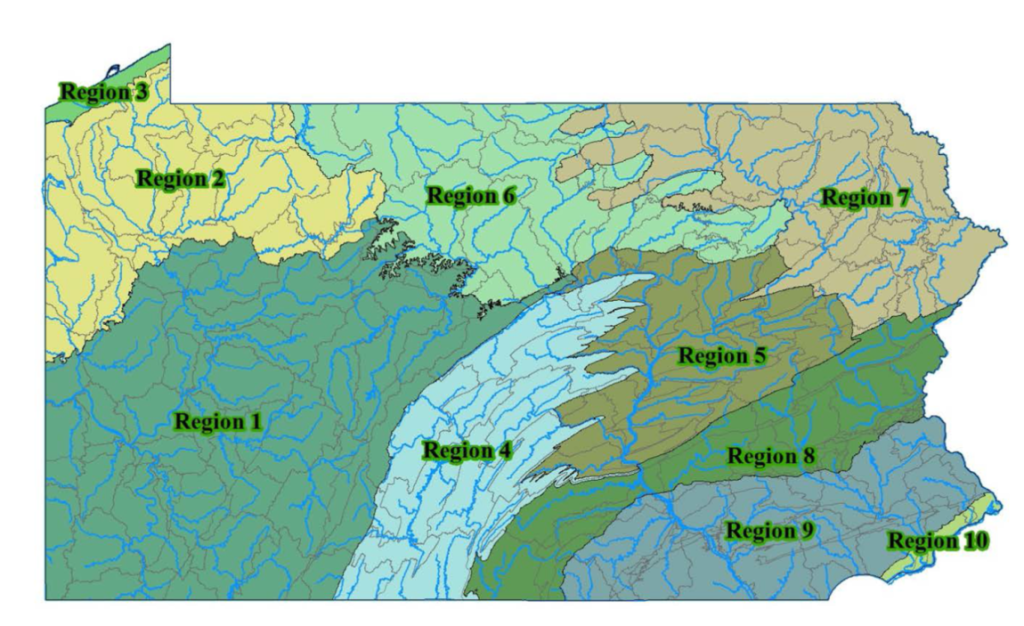
The state was divided into Regions, Sections, and Subarea defined by combination of Physiographic Zones, Watersheds, and Topography:
- 10 Regions, based on Physiographic Zones
- 66 Sections, based on watersheds within regions
- 132 Subareas – two per Section
- Riverine
- Upland
Within each subarea, variables were calculated on various groupings of:
- Digital Elevation Models
- National Wetland Inventory (NWI) (streams, wetlands, and water bodies)
- United States Department of Agriculture (USDA) soils data
- Historical Data
Overall, 91 secondary variables were developed that:
- Represent environment
- Many based on some form of distance
- Euclidian, cost, vertical…
- Analyzed by subarea
- Used most discriminate 10-15
- Tested for redundancy
The entire state was gridded and ranked:
- 10 m grids
- Rated low, moderate, or high
- Aggregated into 30 m grid
- Highest value prevails
- Thematic mapping = color coded
Thresholds for dividing into the three levels were based on some basic statistical assumptions:
- 85% of the sites will be found in 33% of the landscape
- No more than 33% of the true-negative observations will be classified as sensitive
The actual final project deliverable is a set of algorithms that can be run again and again to update the model in the future as more data are received. The results of the current run of data gave us a value for each 10m square of surface area across the entire state. These were aggregated into 30m squares and mapped as the layer that you see in PA-SHARE.

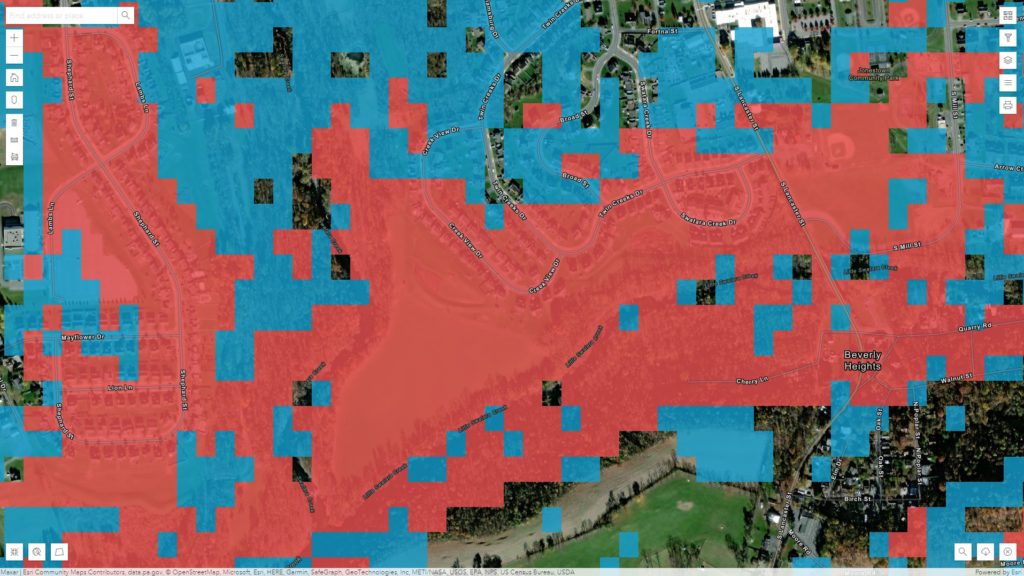
Areas for which the models give a low probability of containing pre-contact archaeological sites will have no color; the other two layers are semi-transparent, so they can be layered on top of either the topographic maps or the aerial photography. It is important to remember that there are only these two colors! If you see more than two, these other color variations will be the result of the colorations on the base maps or other layers.
Ideally, the model would take into account previous ground disturbance, but there is no current way to accurately map disturbance. Complete land use cover is not currently available for Pennsylvania, and such coverage does not necessarily coincide with disturbance that could affect archaeological potential, so disturbance was not considered in the model. As a general rule, the model should be viewed on top of the aerial photography to look for obvious previous disturbance, like the modern housing development in this illustration, and field verified.

The models are in the early stages of their lifecycle and will be continually evaluated and occasionally updated. For proper use of the models in Cultural Resource Management investigations, please see the PA SHPO’s Guidelines for Archaeological Investigations in Pennsylvania.
The datasets upon which the model was based were extracted at the start of the process in Fall 2013. As one test of the model, we have an ongoing intern project to map surveys that have been submitted to PA SHPO since then against the model layers. We are recording the percentage of the project in each probability zone, the methods used to test each area, and whether or not sites were found. We are also looking at newly recorded sites to see where they fit in the models. At the end of this summer we will be evaluating their data to see if we can determine how effective the model is in various regions.
These models are intended to be used as a planning tool and are not a substitute for consultation with the PA SHPO. The models only evaluate the potential for pre-contact sites. The probability of the presence of Contact Period and historic archaeological sites should still be evaluated using historic documentation.
These layers are currently available to registered archaeological users in PA-SHARE. To request archaeological privileges for PA-SHARE, visit https://www.phmc.pa.gov/PA-SHARE/Pages/Request-Archaeology-Privileges-.aspx. More information about the predictive model is available on the PA-SHARE Data Quality page.
Comment Policy
PHMC welcomes and encourages topic-related comments on this blog. PHMC reserves the right to remove comments that in PHMC’s discretion do not follow participation guidelines.
Commenters and Comments shall be related to the blog post topic and respectful of others who use this site.
Commenters and Comments shall not: use language that is offensive, inflammatory or provocative (this includes, but is not limited to, using profanity, obscene, or vulgar comments); disparage other commenters or people; condone illegal activity; identify the location of known or suspected archeological sites; post personal information in comments such as addresses, phone numbers, e-mail addresses or other contact details, which may relate to you or other individuals; impersonate or falsely claim to represent a person or an organization; make any commercial endorsement or promotion of any product, service or publication.
If you would like to comment on other topics not related to this blog post but related to PHMC, please fill out the PHMC Contact Us Form.


In looking at the Pomeroy & Beers 1868 Atlas of Union & Snyder Counties, PA map of Adamsburg (Beaver Springs), about 1 inch above the name Adamsburg is “U. S. Warehouse”. We are trying to find out info on this warehouse as my Aunt’s 1700 home is one of the dots to the left of the “U”. Any info you can give would be appreciated,
Thank you