Did anyone else hear Richard Dawson’s voice yell this out when they read the title of our post today? Perhaps I’m dating myself by knowing who first hosted Family Feud. We didn’t host our own preservation version of one of America’s favorite game shows (but that’s an idea!) but we did host a survey and the results are in!
I know you’ve all been waiting to see what your fellow Pennsylvanians had to say about preservation, their communities, and their priorities. I am happy to share the results of the statewide online public survey we released in April 2016 to help inform Pennsylvania’s next statewide historic preservation plan.
Connecting with Communities for the next Statewide Plan
Let’s start with some background…
We had a ‘soft launch’ of the survey in April 2016 at the PSATS (aka PA State Association of Township Supervisors) annual conference in Hershey. By the time the survey closed in December 2016, we had 3,177 responses and a minimum of two from each county. In addition to PSATS, the survey was promoted by staff and our Planning Partners, at local and regional conferences, and at the Open Houses. This a great response rate for non-scientific surveys like this one and we are so happy to hear from so many Pennsylvanians about preservation.
I’ve provided an overview of the survey results below, and you check out this link for the Final survey results slides. As you’re reviewing the results, you may notice that, for some questions, the total number of responses or the percentage of responses does not equal 3,177 or 100%. Several questions in the survey allowed respondents to select more than one answer, and sometimes they choose a lot and sometimes they choose none.
Demographics
We included a few questions to gather some basic background information on the survey takers:
- Philadelphia County came out on top with 253 responses, followed by Allegheny County (240) and Erie County (214). Mifflin, Montour, and Sullivan counties all tied at two responses each. We haven’t analyzed data to understand which municipalities are represented yet.
- Question #3 asked people to tell us what type of community they lived in based on the options we provided. Small towns won out by a narrow margin, followed closely by the suburbs and rural areas.
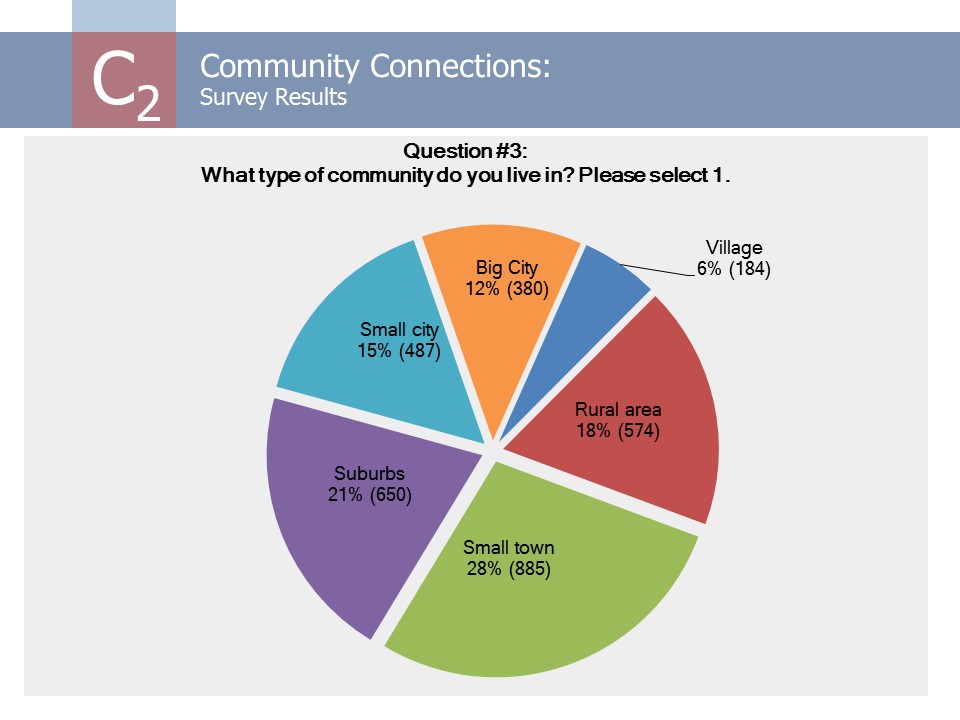
This graph for question #3 shows the distribution of respondents by the type of community in which they live.
- Questions #15 asked whether the survey takers knew that Pennsylvania had a state historic preservation agency, and 13% answered ‘no’ and another 15% answered ‘I thought so but wasn’t sure’. I was actually really happy to see these numbers because it shows that we were able to capture responses from those outside our traditional audiences.
- Question #16 was answered by 2,917 people and the ‘local, state, or federal employee’ category garnered the most selections with 23.4% of the survey pool. Real estate professionals (1.7%) and tradesman/craftsman (2.2%) rounded out the bottom end of the list.
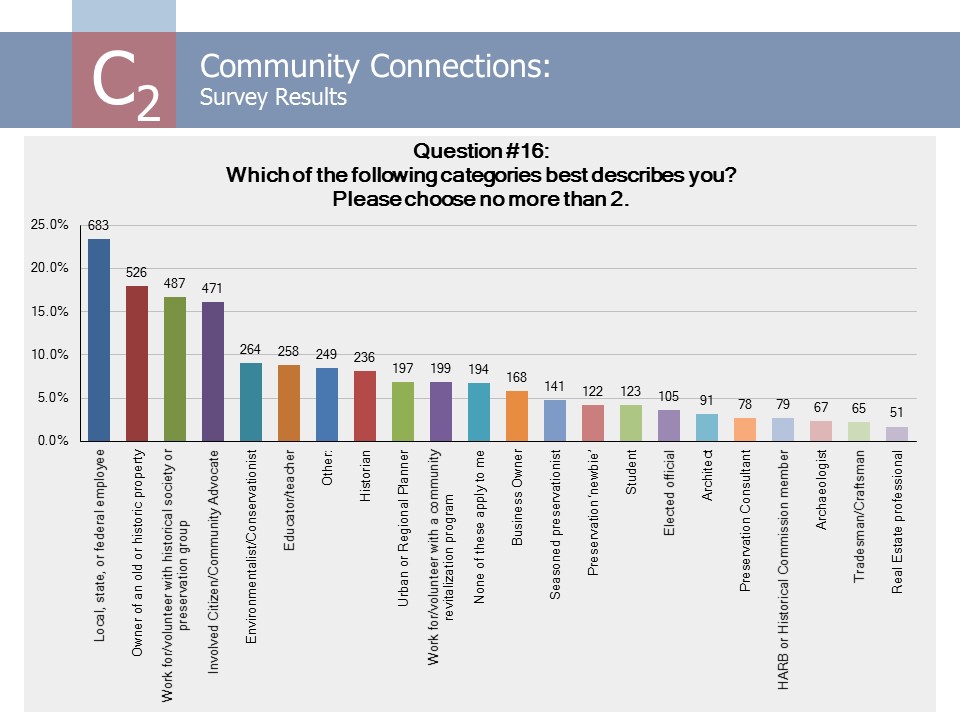
This graph for question #16 shows that people with a range of backgrounds took this survey. The ‘other’ answers provided us with an even broader understanding of our respondents.
Community Perceptions
Questions #4 and #5 focused on how people perceived certain parts of their communities:
- In question #4, local parks and public spaces and trails, waterways & natural areas ranked at the top of the list as the places that best reflect what people value about their community and industrial areas and the highway commercial corridor ranked the lowest. Interestingly, this same question was asked in our 2012 survey for the current statewide plan and had almost identical responses.
- For question #5, 57% of the respondents who answered this question said that older & historic places most enhanced their communities, followed closely by appearance, views, and overall beauty of the area (52.6%).
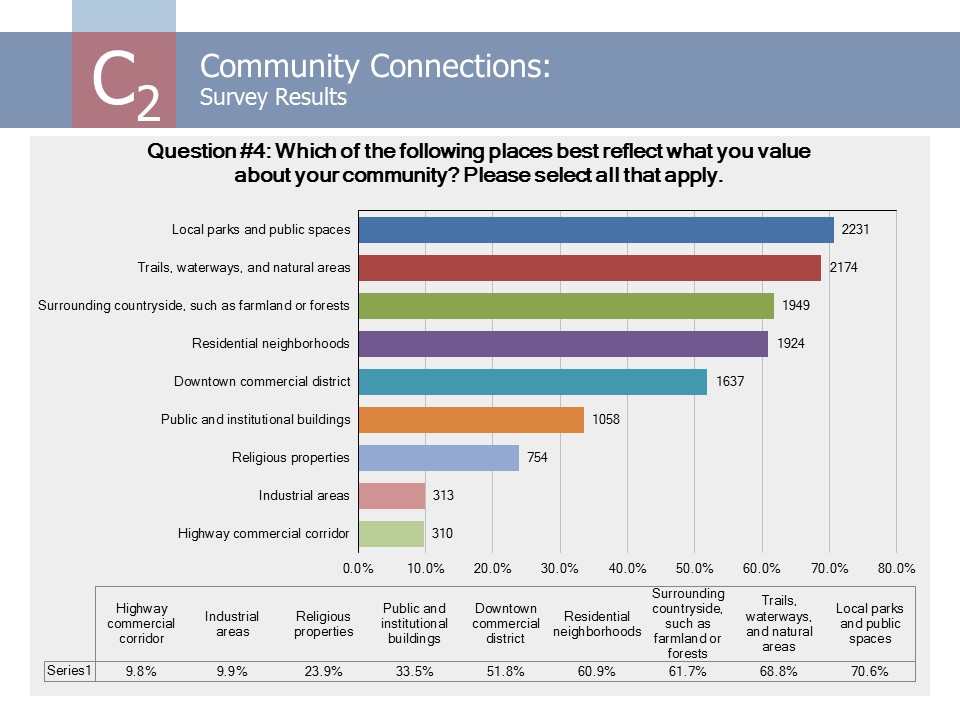
Question #4 asked respondents to tell us which of these resources best reflected what they value in their communities.
Older & Historic Places
Several questions in the middle of the survey were included to understand how Pennsylvanians thought about older & historic properties:
- In question #6, 61% of the survey respondents who answered this question said that older & historic places are important because they protect Pennsylvania’s unique stories and heritage for future generations. 1.6% (46 people) said that they didn’t think that older & historic places make valuable contributions to their community or region.
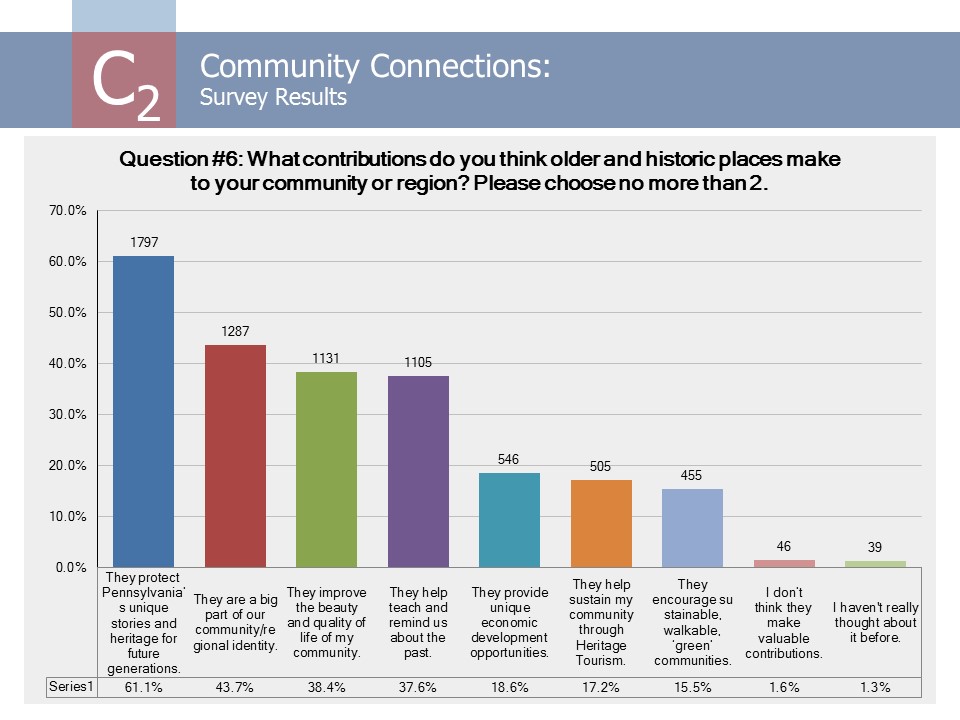
Question #6 asked respondents to choose which of the provided answers best fit their thoughts on the contributions older & historic places make in their communities.
- Question #7 was discussed at our Open Houses and garnered the most criticism and spurred some great conversations. We asked what people notice about the condition of older & historic places in their community and many responded that it was difficult to answer; the general consensus is that many are generally well maintained (35%). Most felt that condition varied within neighborhoods, let alone communities, and was a factor of socioeconomics, local governments, populations, and lots of other factors.
- We asked people to tell us if they are worried about specific types of older & historic places in their communities being negatively changed or lost in question #8. Of the ten answers we provided, three are grouped at the top: 45% said they are concerned about older residential neighborhoods, 42% said the surrounding countryside, and 40% selected the downtown commercial district. We also provided an option for ‘other’ to share more information with us.
- The last question in this category, question #9, asked responders to select the top three challenges they saw in their communities for protecting older & historic places. Little or no funding was the overwhelming choice by 50% of the people who answered this question. 6% of respondents answered that they didn’t know what challenges exist and 3% said that they don’t think there are any challenges.
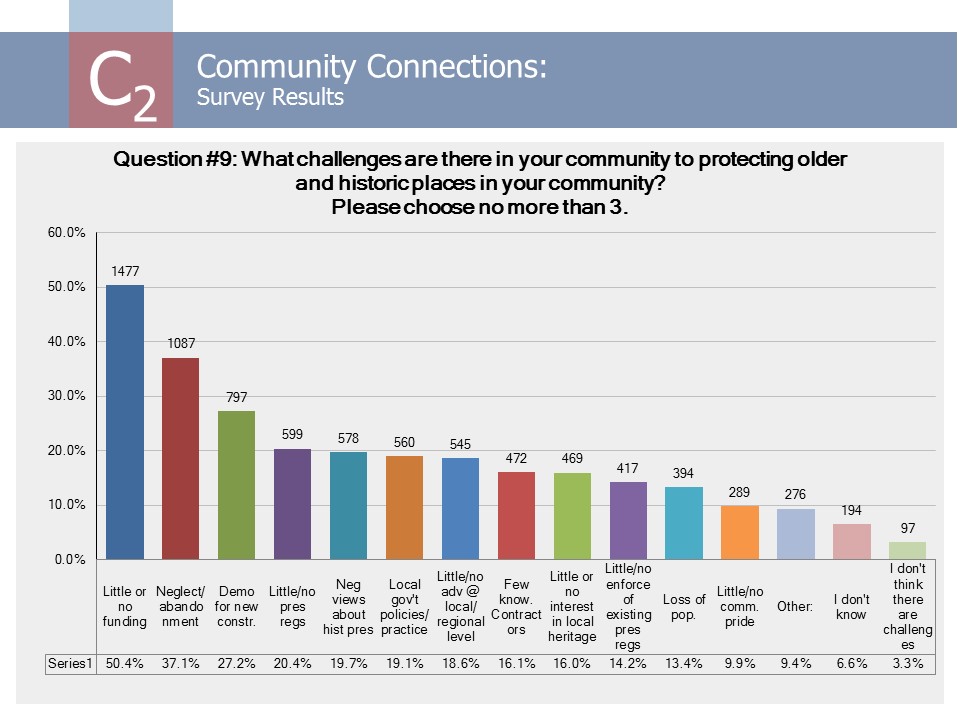
This graph for question #9 shows the full list of answer options; several respondents also provided additional challenges through the ‘other’ option.
Gauging Perspectives
The last set of survey questions were intended to gain an understanding about what and how people think about historic preservation:
- Question #10 asked people to tell us about local preservation regulations. Almost 26% said that they have some protections in their communities, and close to 17% said they need some protections. Only 3% of the respondents answered that they didn’t think their community needed any regulation of property rights.
- The topic of question #11 is pretty standard: do you have a positive or negative view of historic preservation? 78.1% of the 2,904 people who answered this question said they had a positive view while 1.7% said they had a somewhat negative or negative view of historic preservation.
- Similarly, question #12 asked people to tell us which of the answers comes to mind when they see or hear the words “historic preservation”. The majority of respondents (53.8%) said that they think it is part of community planning, followed by 26% who responded that it’s about making sure old buildings and neighborhoods look nice. 4 people (.1%) answered that they don’t know what historic preservation is.
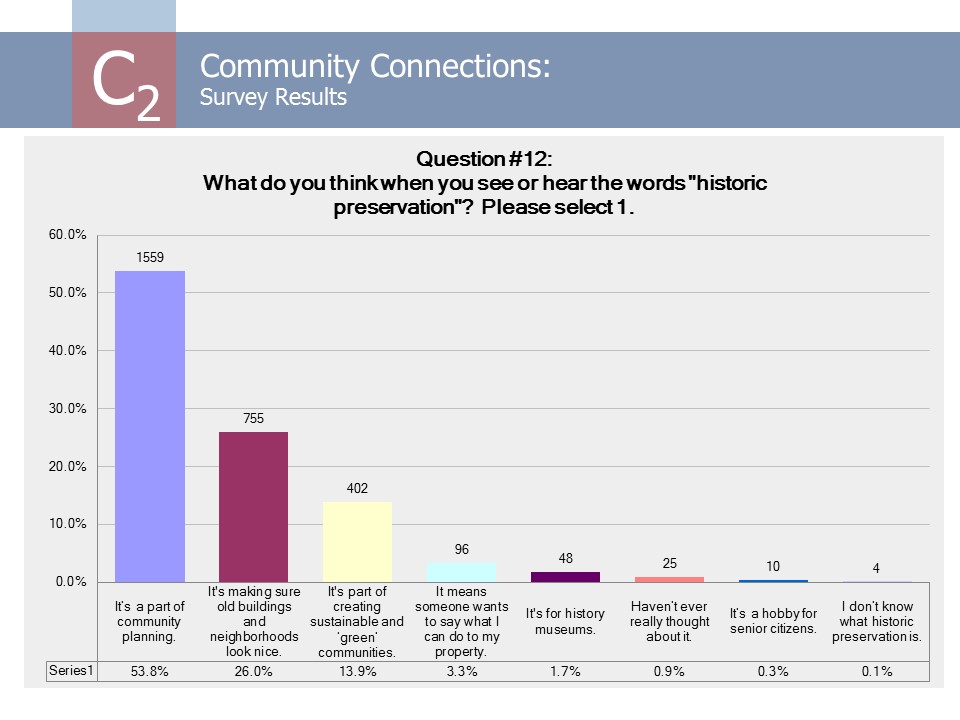
Question #12 asked people to select on of the options that best described what comes to their mind when they see or hear the words ‘historic preservation.’
- Question #12 is a pretty standard question in preservation surveys. 77% of the 7,898 people who answered the question said that public funds, from any source, should be used to support historic preservation. 20% said yes, public funds should be used, but not from taxes; 3% responded that public funding should not be used at all.
- Question #13 is tied to our Disaster Planning for Historic Properties initiative and was asked in a limited survey issued in early 2016 specifically about that topic. 87.7% (2,574) said that they think communities should plan for ways to protect older & historic places from damage or loss from natural disasters and ensure their future preservation. Of the balance of people who answered this question, 2% said no and 10% answered that they’re not sure.
The End (for now)
There are so many fun ways to look at the survey results and slice and dice the data based on particular answers or demographics. I’ve share the overall results with you today, which is a lot of food for thought. Keep checking back for more posts to highlight specific questions and responses and read some of the 1,852 comments that we received.
Thank you to all those who took the survey! If you have any questions about the survey, please get in touch by sending us an email to mail@pahistoricpreservation.com.
Comment Policy
PHMC welcomes and encourages topic-related comments on this blog. PHMC reserves the right to remove comments that in PHMC’s discretion do not follow participation guidelines.
Commenters and Comments shall be related to the blog post topic and respectful of others who use this site.
Commenters and Comments shall not: use language that is offensive, inflammatory or provocative (this includes, but is not limited to, using profanity, obscene, or vulgar comments); disparage other commenters or people; condone illegal activity; identify the location of known or suspected archeological sites; post personal information in comments such as addresses, phone numbers, e-mail addresses or other contact details, which may relate to you or other individuals; impersonate or falsely claim to represent a person or an organization; make any commercial endorsement or promotion of any product, service or publication.
If you would like to comment on other topics not related to this blog post but related to PHMC, please fill out the PHMC Contact Us Form.

Leave a Reply